Get in touch with Tengyang Company


Updated October 2026
A moisture sorption isotherm is a plot of equilibrium moisture content against water activity, or relative humidity, at constant temperature. Read adsorption and desorption separately. A loop can indicate material history or incomplete equilibration, and the curve doesn’t measure the rate of water-vapor transmission.
An increase in water content of a membrane that’s exposed to humid air doesn’t mean that the membrane has failed. Before you compare the two curves, make sure you understand what was weighed. How was “dry” defined? Why did the humidity steps end? Those details decide whether the plotted points describe comparable states. This guide provides a mass basis calculation, a branch worksheet, and a test request form.
TL;DR
- Compare moisture content and water activity only at matched temperature and stated mass basis.
- Keep the wetting path, drying path and timeout flags with the curve.
- Inspect humidity and temperature stability as well as the mass trace.
- Order a separate transmission measurement when the question is through-film vapor flow.
Quick Specs for Reading a Sorption Report
| Quantity | What the report should state |
|---|---|
| Horizontal axis | Water activity, unitless, or relative humidity, % |
| Vertical axis | Water/dry solid or water/total wet mass; percentage or mass ratio |
| Temperature | One stated temperature for each isotherm |
| Path | Adsorption, desorption, or a defined partial humidity cycle |
| Endpoint | Mass-rate criterion, hold time and exceptions |
| Separate transport result | Water-vapor transmission rate, for example g/(m²·day), with its own conditions |
Moisture sorption isotherm axes and equilibrium moisture content
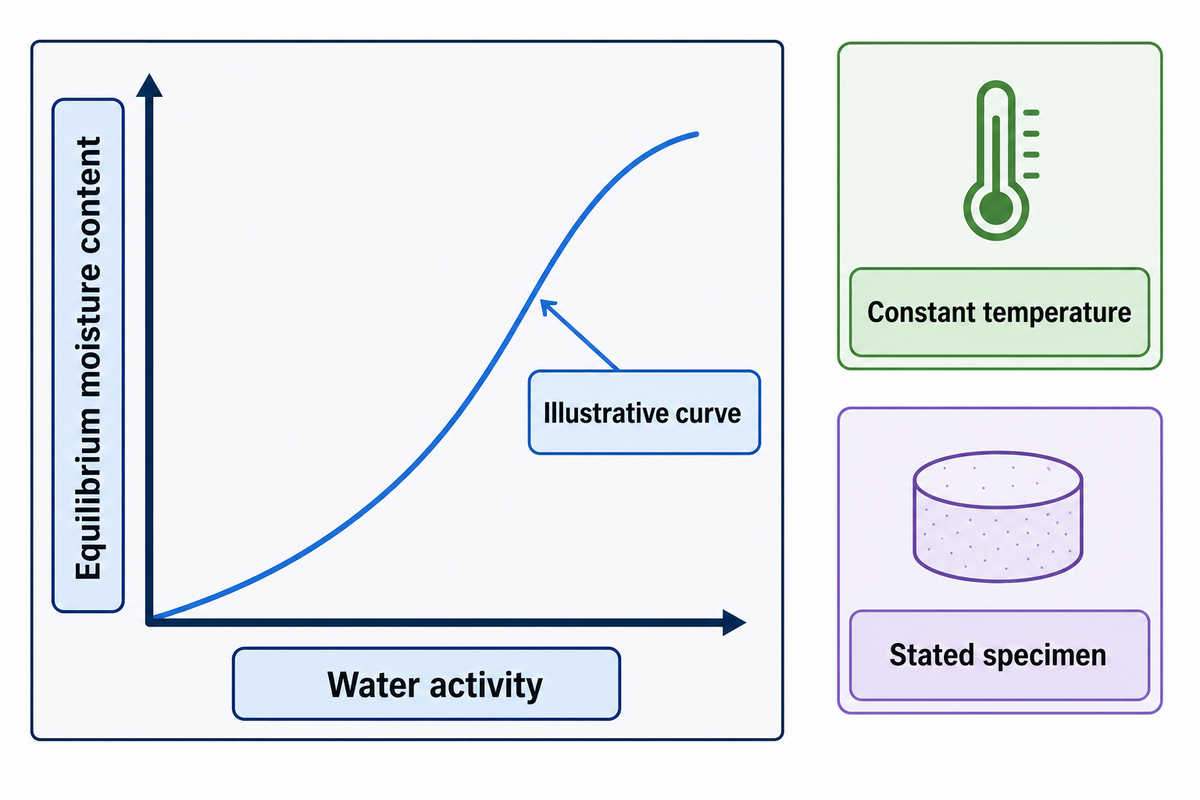
A sorption isotherm connects the sample’s moisture uptake to the surrounding vapor condition at one given temperature. Equilibrium moisture content is the amount of water reported after the sample has attained a validated equilibrium endpoint. A curve needs a definition of the axis, a mass basis, and a humidity history to allow comparison between materials.
What is called isotherm?
An isotherm describes a relationship at constant temperature. In moisture sorption, it relates the water content of the material to water activity or relative humidity after the material has reached equilibrium. For a different temperature, a new curve is required. The word doesn’t define a material or a model equation and doesn’t prescribe how long the sample must be held.
The USDA study of short DVS hold times describes a humidity sequence for constructing a sorption isotherm. The results for wood and isolated wood polymers also indicate the need for an end-point assessment. The authors extended selected holds to 24-50 hours and found slow responses that weren’t evident in measurements of shorter duration. Those longer times shouldn’t be viewed as general-purpose film test times, since they’re specific to the materials tested.
Experimental data describe the sorption process, the measured moisture content and its relation to the specified vapor condition. The relationship between moisture content and equilibrium relative humidity belongs to a stated specimen and temperature. Read the sorption capacity at a specified vapor condition; don’t treat the entire curve as if it were a single material constant. State whether the reported material is a free film, laminate, coated fabric, or a granular resin. Different layers or surfaces may alter what’s recorded. Resin granules aren’t a surrogate for the finished film specimen.
At 25°C, an adsorption point at 60% relative humidity and a desorption point at 60% relative humidity occupy the same horizontal position. Vertically, they may not be the same. No Tengyang film measurement is shown. Humidity and temperature conditions are assumed.
Water activity and relative humidity at equilibrium
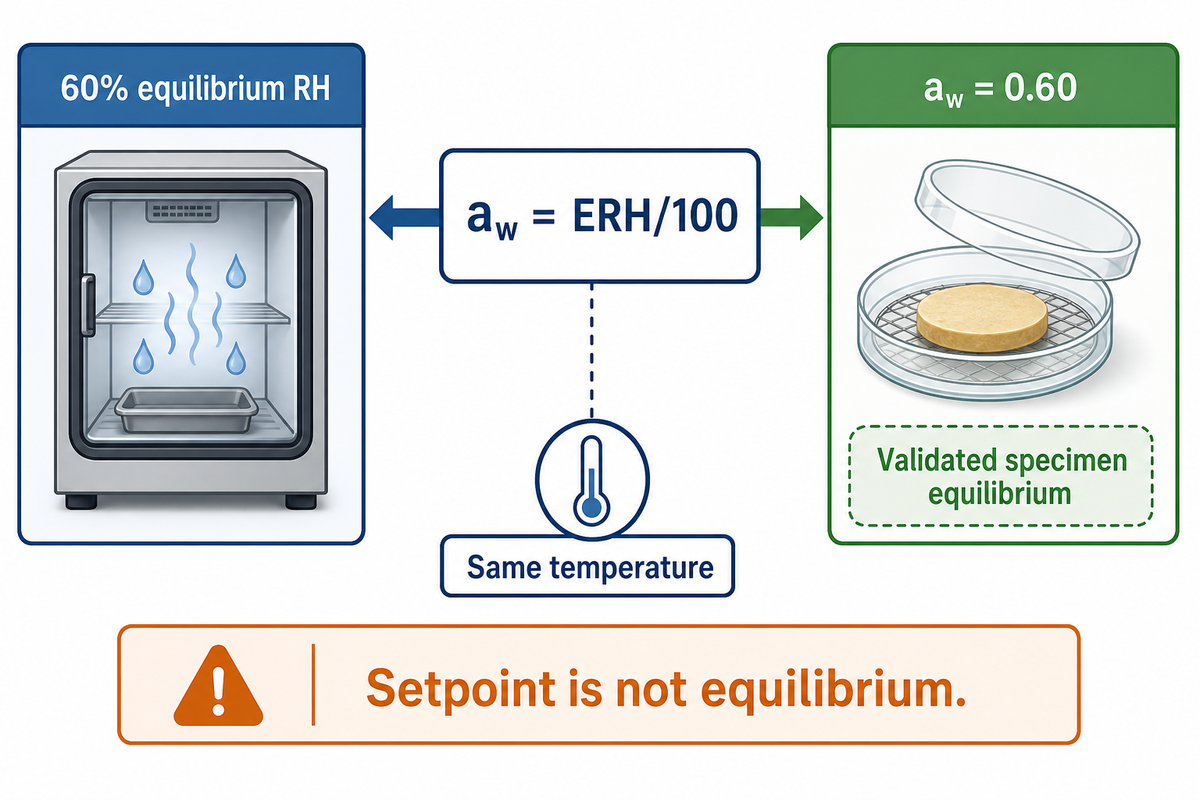
Vapor pressure of water, at a given condition, relative to pure water, is defined as water activity. Equal water activity doesn’t require equal moisture content in different materials.
The U.S. Food and Drug Administration’s water-activity definition gives the equilibrium relation aw = ERH/100. Thus 60% equilibrium relative humidity corresponds to aw = 0.60. The sample and its vapor environment must share the stated temperature. The material reaches that state only when its mass stops changing at a validated endpoint, not when the chamber hits its setpoint.
In describing a food matrix, food science uses water activity and moisture content. A food material’s curve is determined by the material’s composition and temperature.
The relationship between equilibrium moisture content and water activity is material-specific. Sorption isotherms of foods are valid for properties of foods under defined conditions, and their fitted constants don’t generally apply to films. Food processing and storage decisions require evidence beyond the moisture percentage. For a membrane, use the relationship between water activity and retained water without bringing along a food product’s shelf-life conclusion.
A low moisture % and low water activity are two different observations. A film’s moisture level needs a stated mass basis, and its vapor-pressure condition needs temperature and equilibrium records. Increasing moisture content in successive steps of humidity describes uptake. It doesn’t assess a change in food safety or a change in membrane transport.
In the presence of near saturation, condensation must also be considered. Droplets of liquid water in a material aren’t the same as vapor sorption. Unusual jumps in mass must be recorded before assigning a high-moisture point to the curve. Also record temperature changes and visible condensate. Don’t smooth (or explain away) unusual and inexplicable jumps in mass.
A published block-copolymer membrane study limited vapor experiments to 99% relative humidity and below to reduce condensation risk. At 100% rh, it extrapolated results and found consistent uptake for both vapor and the liquid phase for that material. This is more of a measurement boundary case, rather than a universal 99% rh case, or proof that for vapor and immersion cases, the results will always differ.
For a report using 80% equilibrium relative humidity, the corresponding water activity is 0.80. An extrapolated point to 100% relative humidity from the fitted line through the data, has a different status of evidence compared to a point measured at 80% relative humidity.
Dry-basis and wet-basis moisture content
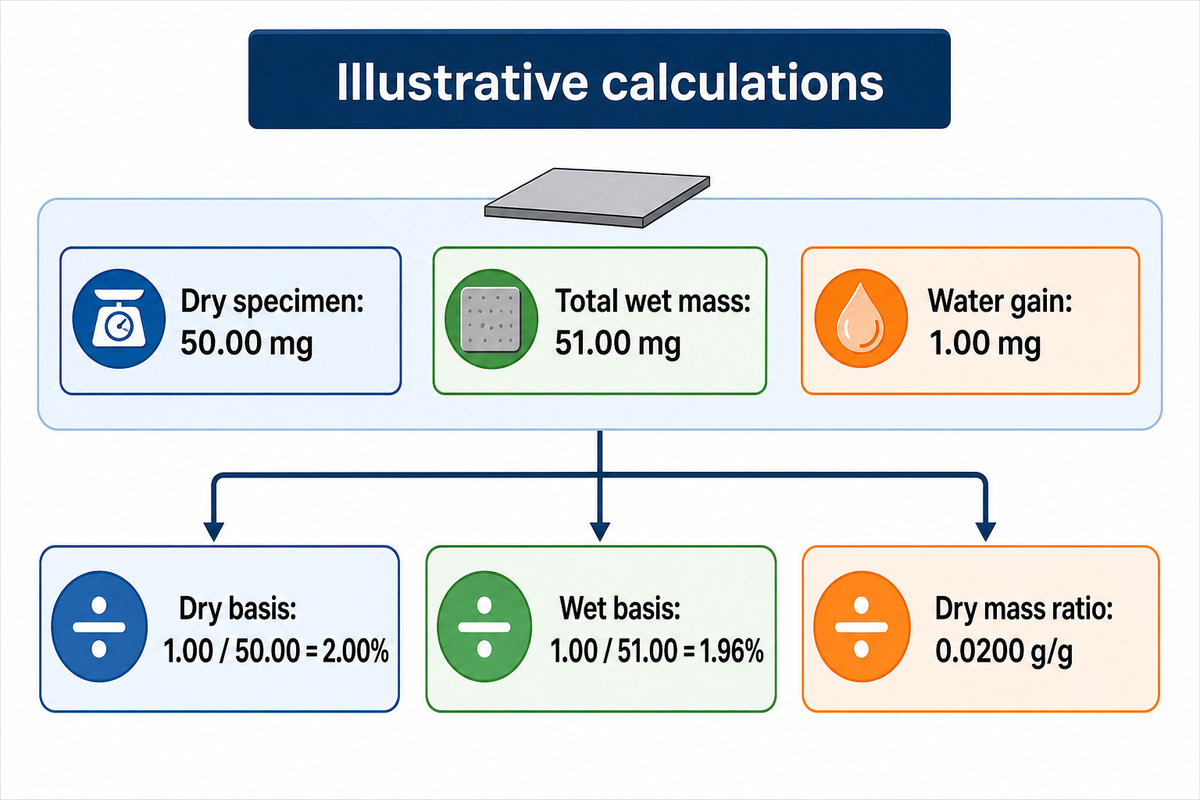
Dry-basis moisture content divides water mass by dry-solid mass; wet-basis moisture content divides water mass by total wet mass. Therefore, one specimen can have two different percentages. Prior to any calculation of either percentage, verify the dry baseline and determine if the observed mass change can reasonably be attributed to water loss or gain as opposed to other loss or gain.
Worked Mass-Basis Example
Assume a stable dry specimen of 50.00 mg and a later mass of 51.00 mg, with the entire 1.00 mg gain assigned to water. Dry-basis moisture content is (51.00 − 50.00)/50.00 × 100 = 2.00%. Wet-basis moisture content is (51.00 − 50.00)/51.00 × 100 = 1.96%. These are illustrative calculations, not product test results.
| Mass-basis type | Calculation | Illustrative result | Limitations |
|---|---|---|---|
| Dry basis | 1.00 mg / 50.00 mg dry solid | 2.00% | Requires a justified dry-solid baseline |
| Wet basis | 1.00 mg / 51.00 mg total wet mass | 1.96% | Denominator changes with water content |
| Dry mass ratio | 1.00 mg / 50.00 mg | 0.0200 g/g dry solid | Not a vapor transmission rate |
The pea-starch film sorption study cites a dry basis to define moisture. Its specimen preparation and determination of moisture are also part of the dry basis. A film containing a volatile additive may lose nonwater mass during drying, and a dried specimen may also change its structure. Record the drying method with the result; one pea-starch sorption study, for example, dried equilibrated samples at 105 °C for 4 h.
Report final moisture, along with its denominator and endpoint. When moisture content is considered without the denominators and endpoints, a numerical comparison can conceal differences in specimen states.
Mass normalization doesn’t eliminate all specimen differences. Consider the formulation, thickness, and exposed surface area. Also, compare the state of crystallinity, coating and support. A water sorption isotherm measured on a whole laminate would include all of the weighed layers. Subtracting the support without a validated correction may create a new uncertainty rather than isolating the film.
A quality engineer comparing an old report marked 2.00% dry basis to a new report marked 1.96% wet basis should first reconcile denominators. In the example provided, the amount of water is the same. Rejecting the new film before conducting the calculation would confuse a notation change with a material change.
In the same example, the 2.00% and 1.96% values relate to the same 50.00 mg dry specimen and 1.00 mg water gain. A test report should provide the denominator next to the number, not in a distant methods appendix. Mass history and baseline make the percentage interpretable.
Adsorption and desorption hysteresis in polymer films
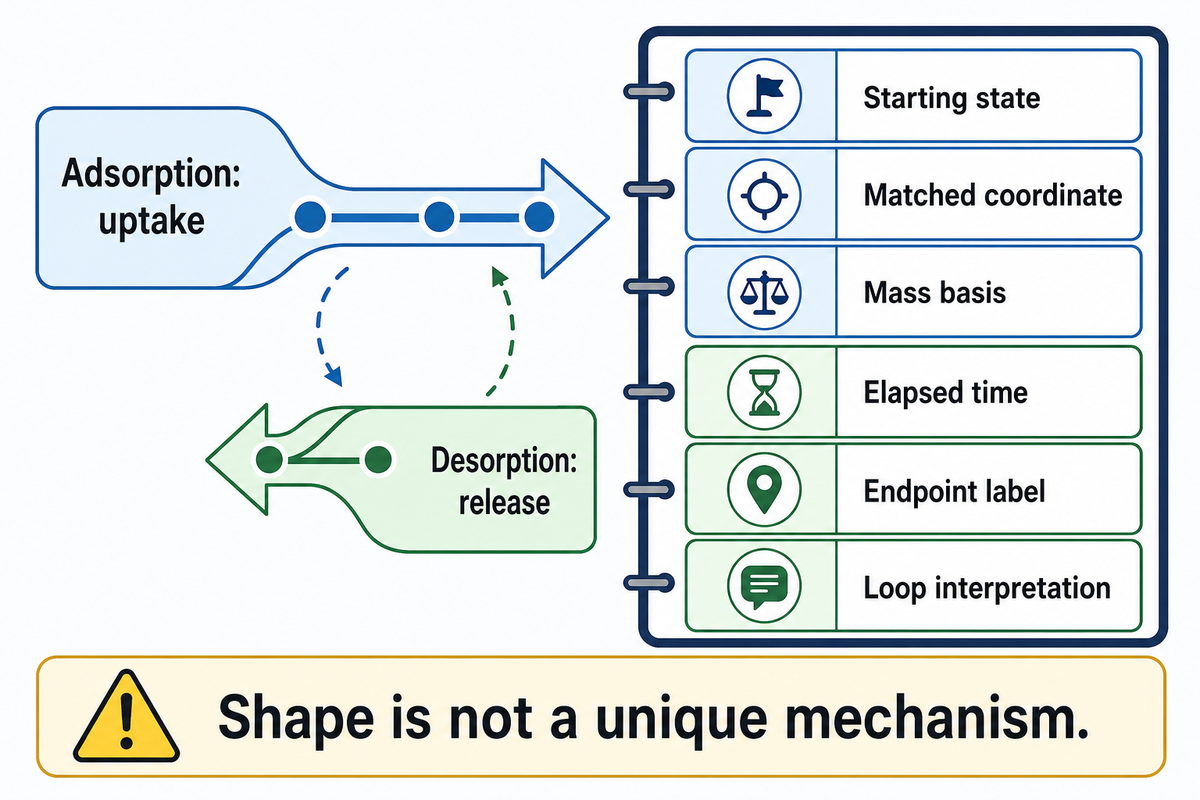
Adsorption and desorption hysteresis means two humidity paths lead to different moisture contents at matched temperature and vapor condition. Relaxation, swelling and history of the polymer, among others, could lead to the separation. An apparent loop can be the result of unfinished humidity steps; check each step’s endpoint before reading the loop as a pore structure or mechanism.
What is an adsorption and desorption isotherm?
An adsorption isotherm follows uptake as vapor activity increases; a desorption isotherm follows release as activity decreases. The starting state and humidity paths for each need to be stated. In polymer reports, “sorption” can include the uptake of water into the bulk, therefore adsorption terminology doesn’t imply that all water is on the surface.
The glassy polyurethane-foam investigation links water sorption history to relaxation and swelling in the studied foam. A foam is a different specimen from a dense TPU membrane. However, the foam study shows a possible history-sensitive polymer response. It isn’t to be taken as a membrane uptake number, or to explain a universal hysteresis.
2-Path Moisture Map
2-Path Moisture Map pairs uptake and release at matched temperature, humidity and mass basis. It retains each endpoint’s history and status.
| Record | Adsorption branch | Desorption branch | Limitations |
|---|---|---|---|
| Starting state | Document drying and conditioning | Document highest humidity and previous hold | A partial return is a scanning path |
| Matched coordinate | Same measured humidity and temperature | Same measured humidity and temperature | Setpoints alone may hide drift |
| Mass basis | State dry reference and units | Keep the same justified reference | Do not compare unlike denominators |
| Elapsed time | Retain each time trace | Retain each time trace | Equal time need not mean equal equilibration |
| Endpoint label | Criterion met or time limit reached | Criterion met or time limit reached | A timeout is not proof of equilibrium |
| Loop interpretation | Record path-specific uptake | Record path-specific release | Shape alone cannot identify a unique mechanism |
Consider a synthesized QA scenario: Two assumed 25°C reports with 60% RH show different uptake. One report’s step ended on its time limit, while the other report’s step met a validated mass-rate endpoint. The first step would be to check endpoint flags and inspect the traces before drawing a conclusion about the films. This does not yet provide evidence of a changed film formulation.
Sorption of water refers to, e.g., surface retention and bulk entry in a polymer. Water molecules may interact with accessible polar groups, and a curve by itself can’t quantify the binding of water or explain each contribution. Therefore moisture sorption behavior demands an explanation considering the limits of the sample and the history of the test.
If the traces are good, look at prep and material history. Previously humidified specimens may not return to the same state as a fresh dry specimen. Keep max humidity, hold duration and previous cycles with desorption isotherms. If repeating the cycle, record which cycle supplied the reported curve rather than averaging several paths.
The site’s guide to polymer structure under heat and humidity provides the greater structural context. A moisture loop, however, is different from advancing and receding contact angles. Neither result replaces the other.
A 60% relative-humidity branch pair at 25°C is interpretable only with its starting states and endpoint labels. Repeating the humidity coordinate doesn’t erase the path. The map retains those distinctions, therefore a reader can pinpoint what needs further testing to identify the reason for the loop.
Dynamic vapor sorption: humidity steps and equilibrium checks
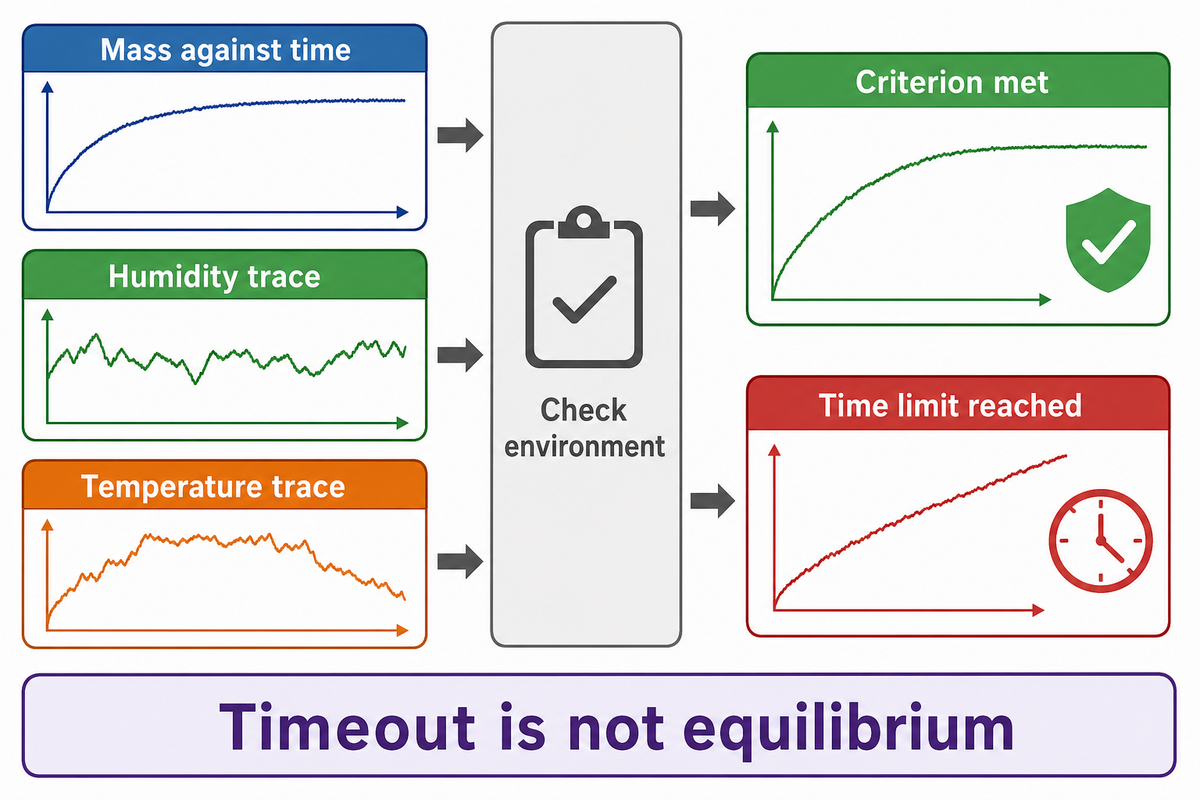
Dynamic vapor sorption records specimen mass with changing levels of humidity at a given controlled temperature. Humidity steps, hold limits and mass-rate rules identify the end points of records. A useful report preserves mass, humidity and temperature against time and checks the stability of the measurement environment. It differentiates a validated end point from a point stopped due to timeout.
In the poly(ethylene vanillate) film study, 600 μm films were tested at 20°C. The authors used 12-hour exposures at each step, yet mass equilibrium wasn’t reached even after 24 hours at 60% relative humidity. They described high-humidity results as pseudo-equilibrium. Those conditions belong to PEV, not a prescribed schedule for TPU.
Humidity steps through a pilot resolve the part of the curve relevant to the application. Smaller steps can evaluate a steeper region of the curve, but increase the number of holds. Using a fixed step size is not automatically an ASTM requirement. Ask the lab to justify the schedule based on the uncertainty, material, and specimen geometry.
Separate the Endpoint from the Instrument Environment
A 2025 interlaboratory sorption study included 80 wood datasets from 21 laboratories. It found disturbances, oscillations and mass decrease during long holds; some oscillations were found to track the temperature of the sorption reservoir. Material response and measurement environment should both be studied. Wood specific error criteria shouldn’t be used to evaluate acceptance criteria for film.
There must be records of humidity readings close to the sample, temperatures, mass stability checks, and justifications for irregular trends. An inert reference can be used to characterize balance stability, but it doesn’t necessarily indicate that a hygroscopic specimen was exposed to stable humidity during a run. Long holds may be used to determine if a specimen is responding slowly to humidity changes, but humidity conditions during the hold can’t be determined by considering only time.
For an illustrative 25°C pilot, a laboratory might consider 0%, 20%, 40%, 60% and 80% relative humidity, then return through 60%, 40%, 20% and 0%. This assumed sequence isn’t a recommendation for every grade. Specify a laboratory-validated endpoint, minimum observation time and maximum hold, and retain any exceptions instead of quietly calling them equilibrium points.
A plant engineer shouldn’t jump to conclude adhesion loss from a single curved high-humidity mass trace. Is there an adhesive or support in the specimen? Does the specimen’s history of humidity match the service? Does the balance trace have disturbances? An adhesion or assembly test may be necessary to resolve the plant’s performance question.
Temperature history belongs with the description of the material. The explanation of “glass transition and melting in polymers” may reveal information that isn’t apparent in a simple temperature history. Don’t assume that the transition temperature of a different polymer applies to this film.
When a Single Sorption Curve Is Not Enough
Don’t approve a grade from a fitted curve when time-limited endpoints aren’t defined, humidity stability isn’t defined or the specimen form doesn’t match the supplied material. Results of the PEV testing (fixed holds) show continued uptake; and results from the inter-laboratory testing (long holds) show environmental disturbances. Both support a request for the underlying traces.
A curve can’t account for through-film flux, adhesion, or a unique sorption mechanism. For those cases, indicate the relevant measurement on the sample or assembly. Regard a missing measurement as an unanswered question rather than a broader performance claim. The test selector beneath this document differentiates those situations.
BET, GAB and Langmuir isotherm model limits
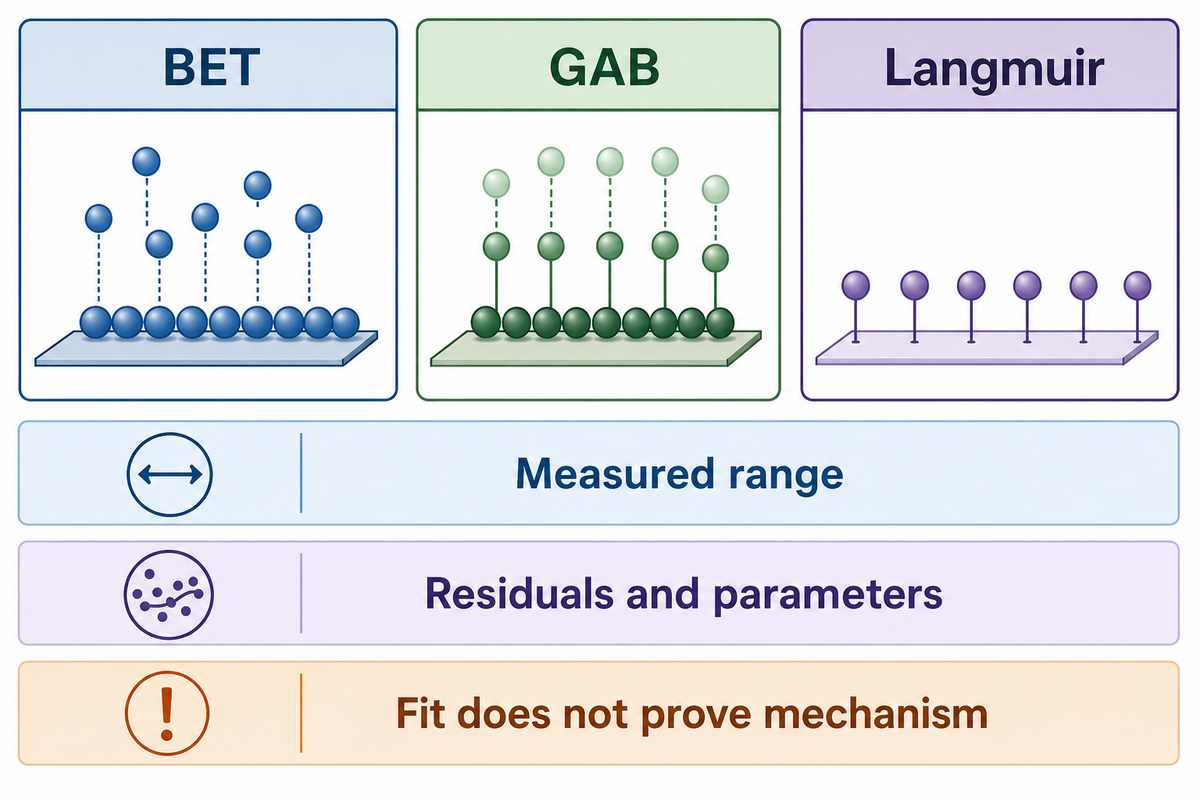
Modeling of water uptake relies on the measured activity range and mass basis. Water adsorption models can summarize experimental data without proving that the polymer obeys an ideal surface mechanism. Bulk absorption and physical adsorption can play different roles; vapor adsorption terminology shouldn’t eliminate that distinction.
BET and GAB are isotherm model frameworks with different assumptions. Choose an isotherm model for the measured range and material, and examine residuals and parameters. A high coefficient of determination can describe a fit without proving the number of available sorption sites, or the state of water within the polymer, or a unique sorption mechanism.
The pea-starch study fitted BET over water activity 0.11–0.50 and GAB over 0.11–0.96; another model, Lewicki, performed best overall. These are study-specific fits. Expressed as equilibrium relative humidities, they correspond to 11%–50% and 11%–96%. A different temperature, formulation or sorption behaviour requires a new assessment.
The USDA review of DVS interpretation provides a clarification for wood. Useful interpolations by common sorption models didn’t render their fitted monolayer moisture content physically meaningful. Don’t use a GAB model’s parameter as measured universal capacity. Deriving heats of sorption or thermodynamic properties from different temperatures requires additional assumptions and uncertainty checks.
Keep adsorption and desorption fits separate, unless the method justifies otherwise. State the fitted range of water activity, residual patterns and parameter constraints as well as excluded points. Using the GAB model beyond the measured range is extrapolation. A fitted monolayer or multilayer description doesn’t transform bulk polymer swelling to a demonstrated surface-limited adsorption process.
Shape Classification Has a Scope
The 2015 IUPAC physisorption report classifies gas/solid shapes into types I to VI, subtypes included. The BDDT scheme of five types is historical. These labels are used to organize adsorption data; a polymer-film moisture curve doesn’t, of itself, point to the mechanism of the corresponding pore.
| Type or material category | Gas/solid description | Limitations |
|---|---|---|
| I(a) | Narrow micropore filling | Not proof of Langmuir behaviour |
| I(b) | Broader micropore filling | Pore evidence is still needed |
| II | Monolayer then multilayer adsorption | Do not infer bulk-film structure |
| III | Weak interaction, no distinct knee | Shape alone cannot rank films |
| IV(a) | Mesopore filling with hysteresis | Not every polymer loop is capillary condensation |
| IV(b) | Mesopore filling without that loop | Loop absence is not proof of no uptake |
| V | Weak interaction followed by filling | Not a universal moisture threshold |
| VI | Stepwise layer formation | Not a general film uptake model |
| Bulk polymer film | May swell and relax during water sorption | Outside a simple gas/rigid-pore assignment |
An experienced materials reader can describe type II and type III shapes without claiming that the model identifies every water-binding site. For film selection, the more critical question is whether the measured isotherm data represent the intended grade, humidity range and endpoint. A model becomes useful when it improves that interpretation and its limits remain apparent.
Studies of moisture sorption isotherms and thermodynamic properties require measurements at different temperatures in order to interpret a sorption heat. A single-temperature curve can’t determine those temperature dependent quantities. For a report that states heat of sorption was calculated, ask for temperatures, matched moisture coordinates, equation and uncertainty. The thermodynamic properties of moisture sorption should be kept separate from the fitted capacity parameter.
Type III isotherms are one gas-adsorption shape family and don’t constitute a universal diagnosis of film structure. Keep the classification’s scope with the plot. Studies of agricultural products and food engineering may use the same mathematical vocabulary; their specimens are different from a finished membrane.
Moisture uptake versus water vapor transmission rate
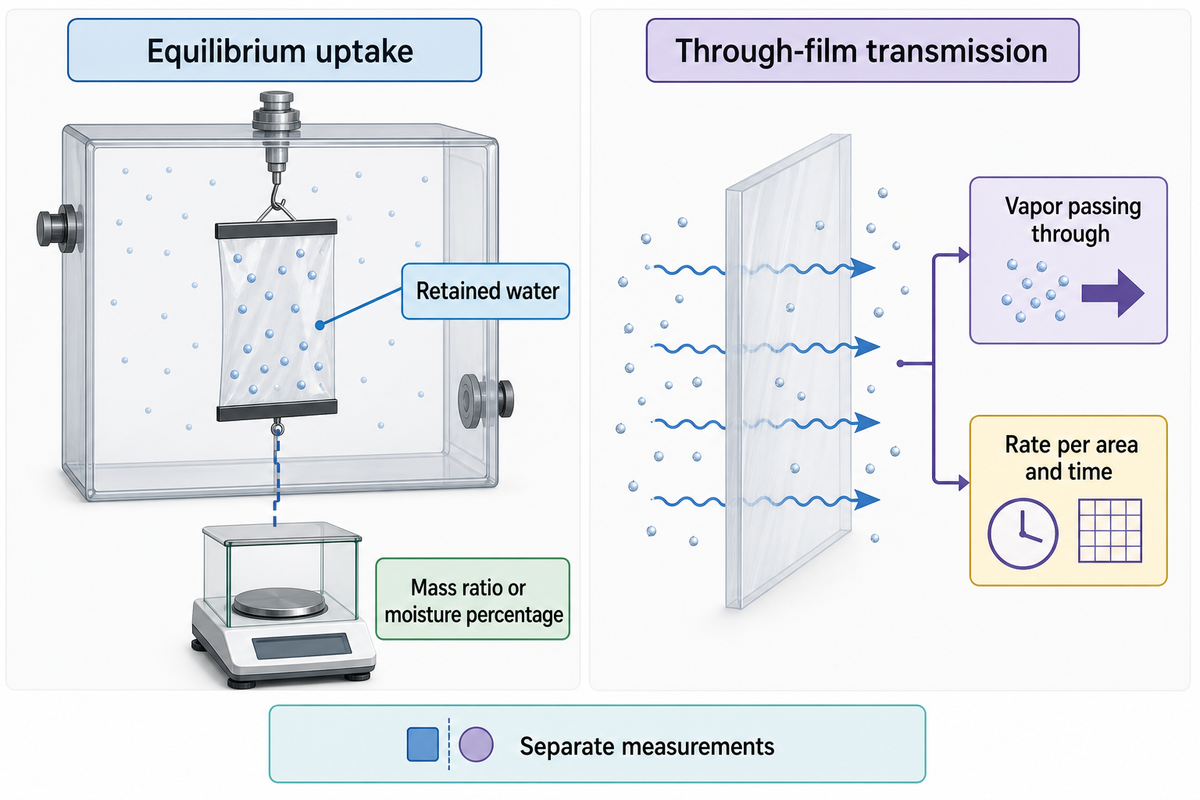
Moisture uptake describes the water retained in a specimen at a stated vapor condition. Water-vapor transmission rate is the flow of water through a specimen per unit area and time at a stated driving condition. The two aren’t interchangeable. To compare membranes, the same material should be used and separate measurements should be performed for retention and transport.
Water-vapor transmission through flexible barrier materials is the focus of ASTM’s current F1249-25 public scope. The thickness and pressure relationships also carry qualifications, so measured rates cannot be scaled to thickness or humidity without confirming those relationships apply to the test conditions and material.
Equilibrium Uptake
- Tracks water retained in the weighed specimen.
- Reports a mass ratio or moisture percentage.
- Requires a stated temperature, path and endpoint.
Through-Film Transmission
- Tracks vapor passing through the specimen.
- Reports a rate per area under defined conditions.
- Requires its own method, geometry and driving condition.
The Hong Kong Polytechnic University record of dense polyurethane-membrane research describes equilibrium sorption, dynamic sorption and water-vapor permeability as separate measurements. The abstract links polyurethane structure to water transport. Measure sorbed water and vapor transport separately for each grade and morphology.
For a breathable TPU membrane, the relationship described in the document is practical. Humidity can affect the film’s water content and for the membrane application, there should be another account of vapor moving through the film or laminate. For each case under the stated conditions, one should ask for the results instead of making an assumption about breathability based on an uptake curve. This document doesn’t report any test result for this product.
Uptake-or-Flux Test Selector
The Uptake-or-Flux Test Selector describes a material question, and identifies the measured quantity, and states what a sorption report can’t answer.
| Reader decision | Request or measured output | Specimen/condition to match | Limitations |
|---|---|---|---|
| Equilibrium water retained | Mass-normalized uptake | Grade, temperature and mass basis | Does not measure through-film flux |
| Wetting/drying difference | Paired branches and time traces | Starting states and full humidity path | Does not identify a unique mechanism |
| Uptake speed | Mass versus time | Geometry, humidity step and environment | Not an equilibrium capacity by itself |
| Vapor transport | Transmission/permeance test | Thickness, exposed area and driving conditions | Not inferred from retained moisture |
| Effect of formulation | Matched-grade measurements | Composition and morphology | A common polymer name is insufficient |
| Effect of thickness | Test selected thicknesses | Measure actual film thickness | Do not assume simple inverse scaling |
| Laminate behaviour | Test the intended assembly | All layers, orientation and support | Free-film data may not represent laminate |
| High-humidity endpoint | Trace with condensation review | Sample environment and measured range | Extrapolated saturation is not measured |
| Service bonding response | Relevant adhesion/assembly test | Substrate, conditioning and loading | Sorption alone cannot qualify bonding |
A procurement buyer who receives an uptake report but needs a transmission rate can now identify the missing report. One should ask for a capability statement from the testing laboratory for both measured quantities, the film or laminate of interest, attainable conditions and raw-data outputs. A brand name or balance-resolution number alone doesn’t indicate the testing laboratory can perform the test on the sample of interest.
Polymer-film test requests that produce comparable reports
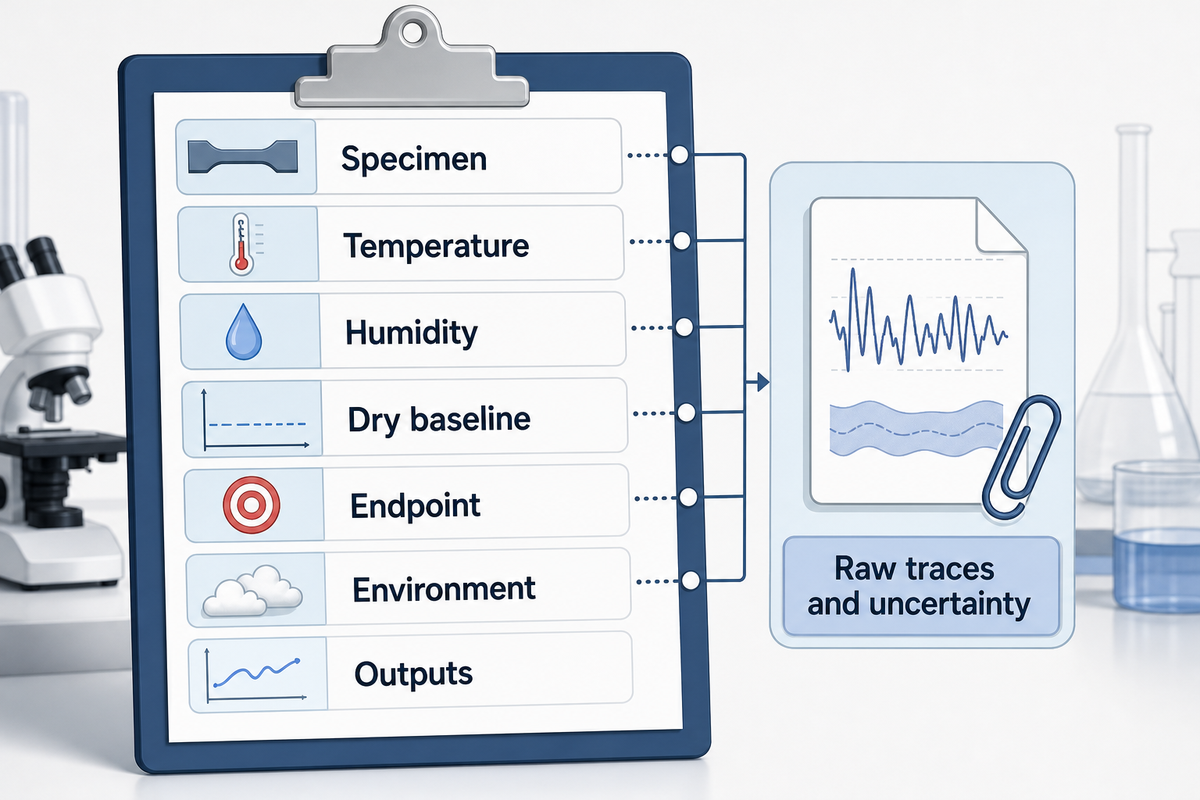
Reports for similar tests must include matching sample identity, preparation, temperature and relative humidity history, mass basis and end point treatment. Reports must include evidence that the measurement environment was stable. A test request must include the decision to be made and the outputs required. The laboratory must identify uncertainties; a completed checklist doesn’t ensure comparability.
Two official scopes prevent common method confusion. ASTM C1498-04a(2023) addresses hygroscopic sorption isotherms of building materials. ASTM E104-20a addresses constant-humidity environments using aqueous solutions in small closed containers. Neither public scope establishes a complete universal DVS procedure for a finished polymer membrane. Specify the applicable edition and ask the laboratory to explain its actual method.
For isotherm measurement and use, a decision has to be agreed upon before the reporting format is defined. Inform the laboratory to compare moisture adsorption isotherms, investigate a branch difference, or measure vapor flow, as the case may be. Sorption properties and transport properties require separate outputs.
Matched Film Test Brief
Example only: a buyer submits an unlaminated film with an assumed nominal thickness of 50 μm and wants adsorption/desorption at 25°C. The illustrative priority points are 20%, 60% and 80% relative humidity. The laboratory must confirm specimen suitability, measure thickness, propose conditioning and validate endpoints. No result or acceptance threshold is assumed.
Copy the following requirements into the quote request, and replace application defined entries with agreed test conditions. The ranges aren’t universal material specifications. Retain the lab’s proposed values and justification with the final order.
RFQ checklist — copy these into your quote request:
| Parameter | Recommended range | Why it matters | How to verify |
|---|---|---|---|
| Specimen | Supplied grade, layers and thickness in μm | Resin name does not define the assembly | Material identification and thickness record |
| Temperature | Application-defined °C | Each isotherm has a temperature boundary | Actual sample/chamber trace |
| Humidity | Application-defined %RH, both paths | Path and condensation affect interpretation | Measured humidity trace and exceptions |
| Dry baseline | Validated dry-reference mass in mg | Denominator controls moisture percentage | Preparation and stability record |
| Endpoint | Validated mass-rate criterion and hold limits | Timeout can leave unfinished uptake | Raw mass-time data and flags |
| Environment | Laboratory-validated stability | Instrument changes can resemble sample response | Temperature/humidity and inert-reference checks |
| Outputs | Mass basis, branches, repeats and uncertainty | Curves need their supporting records | Example report and agreed data package |
How will the lab distinguish a criterion-met point, a time-limited point and an excluded disturbed point? Request the measured range and any fitted or extrapolated range separately. If transmission is part of the decision, add its method, thickness and driving conditions as another deliverable rather than another column inferred from the isotherm.
The material-test report reading guide provides a background to the report. For this moisture test, include sufficient information for a reader to reconstruct the denominator, humidity path and endpoint decision. A plotted curve without the information above leaves the key comparison questions unanswered.
Key takeaway
A moisture sorption curve supports a bounded uptake comparison only when specimen identity, mass basis, path, endpoint and environment are recorded; vapor transmission remains a separate measurement.
Frequently Asked Questions
Q: What are the three regions of a moisture sorption isotherm?
One published sorption study puts the three regions below water activity 0.3 (monolayer), 0.3 to 0.7 (multilayer) and above 0.7 (weakly bound water); the boundaries shift with the material.
A low-activity region may emphasize stronger water binding, an intermediate region may be described with multilayer uptake, and the high-activity region may show a steeper rise. Treat this as an explanatory framework, not three universal humidity intervals. Polymer swelling, relaxation or condensation artifacts can complicate the picture. Use measured data and the model’s stated scope before assigning a mechanism to any region of a film curve.
Q: What are the three assumptions of the Langmuir isotherm?
The ideal Langmuir model assumes equivalent sites, one adsorbed molecule per site, and no interaction between adsorbed molecules.
Amrita Vishwa Vidyapeetham’s teaching notes list these idealizations together with a common adsorption mechanism. Those assumptions produce a monolayer description with a finite adsorption capacity. A swelling film usually departs from them, because water also enters the polymer bulk instead of sitting only on equivalent sites. A fit can be useful over a limited range while its physical interpretation remains uncertain. Compare residuals and the material’s behaviour, and do not equate every type-I shape with a verified Langmuir mechanism.
Q: What is the difference between Langmuir and Freundlich isotherm?
Langmuir describes ideal site-limited monolayer adsorption; Freundlich is an empirical power-law relationship often used for heterogeneous sorption.
The basic Freundlich form does not impose the same finite saturation capacity as ideal Langmuir. Neither model name establishes validity for a particular water-polymer system. Select the measured activity range first, compare fit residuals and constraints, and state where the fitted curve is being extrapolated. The preferred equation can change with material, temperature and range. A better statistical fit still needs a separate assessment before its parameters are interpreted as physical water-binding quantities.
Q: What are the different types of sorption?
Sorption includes adsorption at surfaces and absorption into a material’s bulk; desorption is the reverse release process.
A polymer can retain water through more than one contribution. Moisture-curve shape alone does not separate them. Historical five-type adsorption charts and IUPAC gas-adsorption types describe curve families, not an exhaustive classification of every bulk-film sorption mechanism.
Q: How to determine moisture sorption isotherm?
Measure specimen moisture at several controlled vapor conditions at one temperature, preserving the preparation, mass basis, humidity path and endpoint record.
Start with an identified specimen and a justified dry baseline. Set controlled humidity, monitor mass over time, and apply an endpoint criterion validated for the material and geometry. Continue over the agreed adsorption path; add a documented desorption path if hysteresis is part of the question. Plot the resulting moisture content against water activity or relative humidity, retaining time-limited and disturbed-point flags. Automated DVS records a continuous mass history, while laboratories using the static gravimetric method can use controlled-humidity enclosures and repeated weighing. A saturated salt solution sets the humidity; equilibrium is a mass criterion, such as three consecutive weights differing by less than 1.0 mg per g of dry solid. Check temperature and humidity stability, and inspect possible condensation at high humidity. Report measured and fitted data separately, with repeatability or uncertainty evidence appropriate to the decision. Most prior DVS data used 60 min holds or a change below 0.002% per minute over a 10-min period, and the USDA wood study found those criteria cut slow uptake short.
Scope of This Moisture-Reading Guide
This guide connects published sorption research with film-test interpretation. The mass calculation and buyer scenarios are illustrative; the wood, starch, PEV, foam and membrane studies retain their own material boundaries. It gives readers a way to question endpoint labels and separate moisture uptake from vapor transport. It doesn’t report Tengyang testing, a product qualification, or a service-life prediction.
Related Articles
- Heat-capacity baselines from calorimetry another example of keeping preparation and normalization with a reported value.
- Direction-sensitive thermal measurements match specimen and test conditions before comparing numbers.
- Load-history limits in fatigue testing why a measurement’s history matters.
- Viscoelasticity and polymer response over time background for time-dependent interpretation.
References & Sources
- Short hold times in DVS measurements U.S. Department of Agriculture, Forest Service
- Water Activity (aw) in Foods U.S. Food and Drug Administration
- Water uptake in a PSS-PE membrane Published research, available through PubMed Central
- Water sorption in pea-starch films Published research, available through PubMed Central
- Water sorption hysteresis in glassy polyurethane Scientific Reports
- Water-vapor sorption in poly(ethylene vanillate) films Polymers
- Interlaboratory study of sorption data quality Adsorption, 2025
- Interpreting DVS measurements U.S. Department of Agriculture, Forest Service
- Physisorption of gases: 2015 Technical Report International Union of Pure and Applied Chemistry; primary report PDF mirror
- Adsorption Isotherm: Langmuir assumptions Amrita Vishwa Vidyapeetham; university teaching notes, not a polymer test report
- ASTM F1249-25: public scope ASTM International
- Dense segmented polyurethane membrane research Hong Kong Polytechnic University
- ASTM C1498-04a(2023): public scope ASTM International
- ASTM E104-20a: public scope ASTM International