Get in touch with Tengyang Company
Glass Transition Temperature: The Engineering Guide to Tg


September 2026 Update: polymer-Science User Guide for Engineers and Buyers
Glass Transition Temperature is a method-dependent interval during which segmental motion becomes possible in the amorphous part of a polymer. During this interval, the melting temperature, the upper limit of service at a given temperature, and the approval of material grade are irrelevant. The interesting question is, “How was this Tg value determined?”
This guide explains the physics behind why different values are reported by differential scanning calorimetry (DSC) and dynamic mechanical analysis (DMA). Further, this guide explains the limitations of Tg values and the kind of engineering conclusions that can not be drawn from Tg values. This guide is purely instructive, it neither interprets a buyer’s grade report, nor suggests what adhesive to buy.
The Signal-to-Decision Boundary
- Signal: identify what the instrument observed.
- Criterion: identify onset, midpoint, inflection, or peak.
- Context: retain method, rate or frequency, specimen, and history.
- Boundary: state what the result does not prove.
- Decision evidence: add application tests before qualifying a grade.
What Glass Transition Temperature Actually Describes

Movement of segments of polymer-chains at lower temperatures can be too slow to be detected in an experiment. The material can then be said to have a “glassy state”. A glassy state can be stiff, hard and brittle. Increasing temperature permits more segmental motions. Damping and relaxation, such as the relaxation of stiffness, may occur over a range of temperatures (temperature range). Heat capacity, volume, and dimensions may change across that range of temperatures.
That time dependence is central. A faster observation can make the molecular chains appear less mobile; a slower observation gives them more time to rearrange. Heating rate, cooling rate, oscillation frequency, and the history of the material therefore belong beside the result. The National Institute of Standards and Technology publication record on measurement and underlying physics treats glass transition as a kinetic phenomenon connected to measurement, relaxation, and physical ageing.
One teaching model is free volume. According to this model, motion becomes easier when segments of the chain possess more thermal energy and have accessible space for intermolecular interaction. Free volume is predicted to be applicable to a broad range of polymer systems. However, intermolecular interaction, molecular architecture, branching, stereochemistry, copolymer composition, the nature of the plasticizer, cross-linking, and morphology may govern the limiting free volume.
Reporting Tg on a datasheet is useful because it helps with quality control and comparison. However, reporting Tg is not always straight forward. It often requires careful interpretation of a wider thermal signal. To be of any use, the description of the measurement method also needs to be reported. “Tg = X °C” would not be very useful. One more informative example would be “Tg determined by DSC mid-point during the second heating run at a rate of 10 °C/min after conditioning the sample at the control temperature of 0 °C for 30 minutes.” It is important that the measurement protocol also be reported so that the result may be duplicated.
| Common wording | Engineering interpretation |
|---|---|
| “Tg is the temperature,” “glass temperature,” “specific temperature,” or “exact temperature” | These are shorthand. The reported temperature represents a selected criterion within an interval, with method and material history attached. |
| “Changes from a rigid state” to a “soft and rubbery,” “soft and flexible,” or “rubbery state” | This visual summary can help explain changing mechanical properties, but it does not guarantee a particular loss of rigidity and strength. |
| “Hard and brittle below Tg” or “well below their glass transition” | Either response may occur, but the material’s formulation, morphology, test rate, and history still control the observed behavior. |
| “Second-order transition” versus “first-order phase transition” | Glass transition is often described as second-order-like, whereas crystalline melting is a first-order event. Kinetics and the selected measurement criterion still matter. |
| “Used to measure the glass” or “measure the glass transition temperature” | The instruments follow signals, not glass itself. When heat is applied in calorimetry, heat flow and temperature change are tracked; mechanical analysis follows frequency-dependent temperature behavior. |
| “Highly ordered,” “highly ordered crystalline,” or “temperature where crystalline regions disappear” | Those phrases concern crystalline order and melting. In a semicrystalline polymer, Tg concerns mobility and disorder in its amorphous regions. |
| “Many polymers,” “polymers like methacrylate,” or “molecular chains” | These broad labels do not fix direction or magnitude. The role of chemical structure must be evaluated before claiming an impact on polymer response. |
| “3D printing,” “slower cooling rates,” or “better dimensional stability” | These are application questions. Whether a polymer changes as expected requires evidence from the actual grade, process cycle, geometry, and operational temperature range. |
| “Importance of glass transition” in “materials science and engineering” | Its importance is as a method-bound indicator of mobility and response, not a stand-alone approval rule. Unit searches may show “°c”; technical reports should preserve the source notation. |
Glass Transition vs Melting and Crystallization
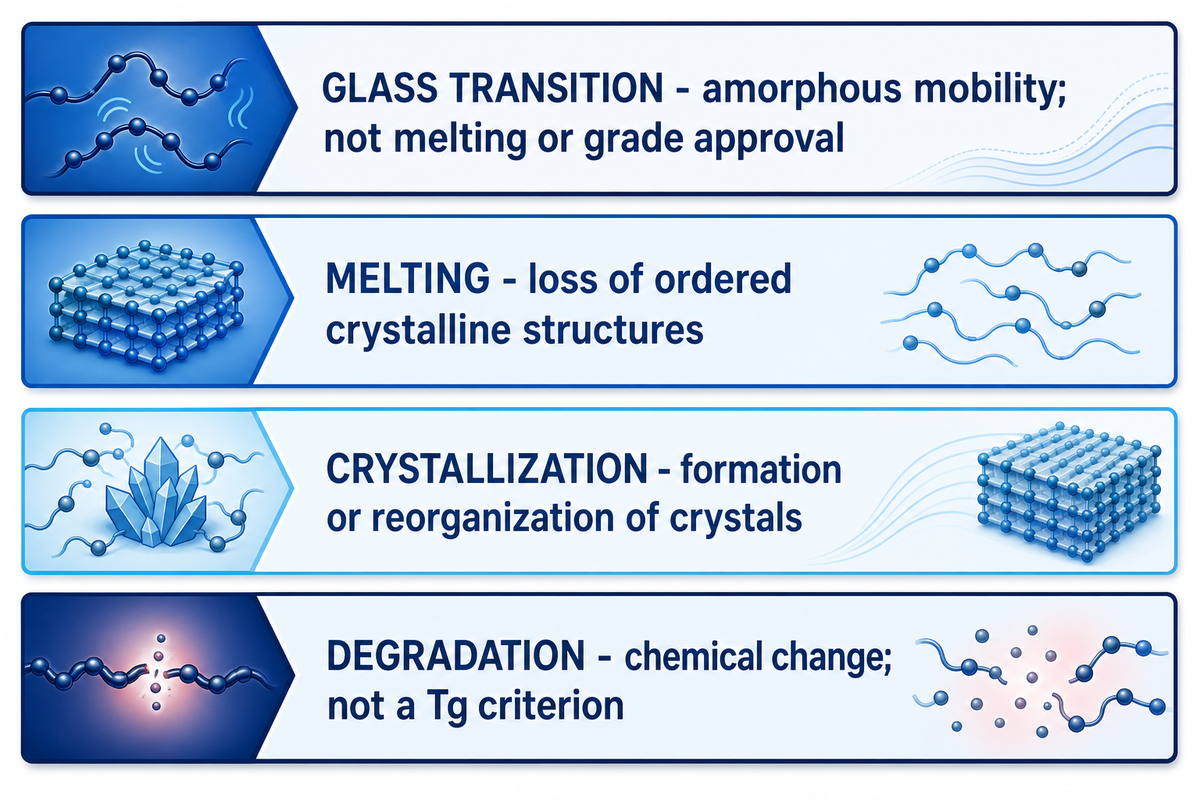
What is the difference between melting temperature and glass transition temperature?
Glass transition describes mobility across amorphous regions. The complete loss of ordered crystalline structures results from material-melting processes. Not all amorphous polymer materials show a crystalline melting point. An ordered crystalline thermoplastic can show a Higher-Temperature melting event. An amorphous thermoplastic can exhibit a glass transition.
| Event | Structural region | Typical calorimetric feature | Requires crystals? | What it cannot prove alone | |
|---|---|---|---|---|---|
| Glass transition | Amorphous fraction | Baseline step in heat capacity | No | Melting, service limit, or grade approval | |
| Melting | Dynamic mechanical analysis can report a different Tg because it follows frequency-dependent mechanical response, while differential scanning calorimetry follows a heat-capacity change. Storage-modulus onset, loss-modulus peak, and tan-delta peak are separate criteria, so each result needs its frequency, strain, geometry, temperature program, and stated criterion. | Ordered crystalline phase | Endothermic peak under stated conditions | Yes | Long-term dimensional or joint durability |
| Crystallization | Formation or reorganization of crystals | Exothermic feature on cooling or cold crystallization on heating | It creates crystals | A universal morphology outside that thermal program | |
| Degradation | Chemical structure | Method-dependent; not a Tg criterion | No | Reversible softening |
This is why using a standard table of polymer temperatures can be misleading. Values for materials such as polyethylene, polystyrene, and others can not be generally applied. The same applies to polymer type, morphology, conditioning, and scanning conditions.
Because of the components present in formulated adhesives, which can include resins, plasticizers, and fillers, the response of the adhesive can be broadened. For this reason, the response of a formulated adhesive should be interpreted with caution.
How Differential Scanning Calorimetry Measures Tg
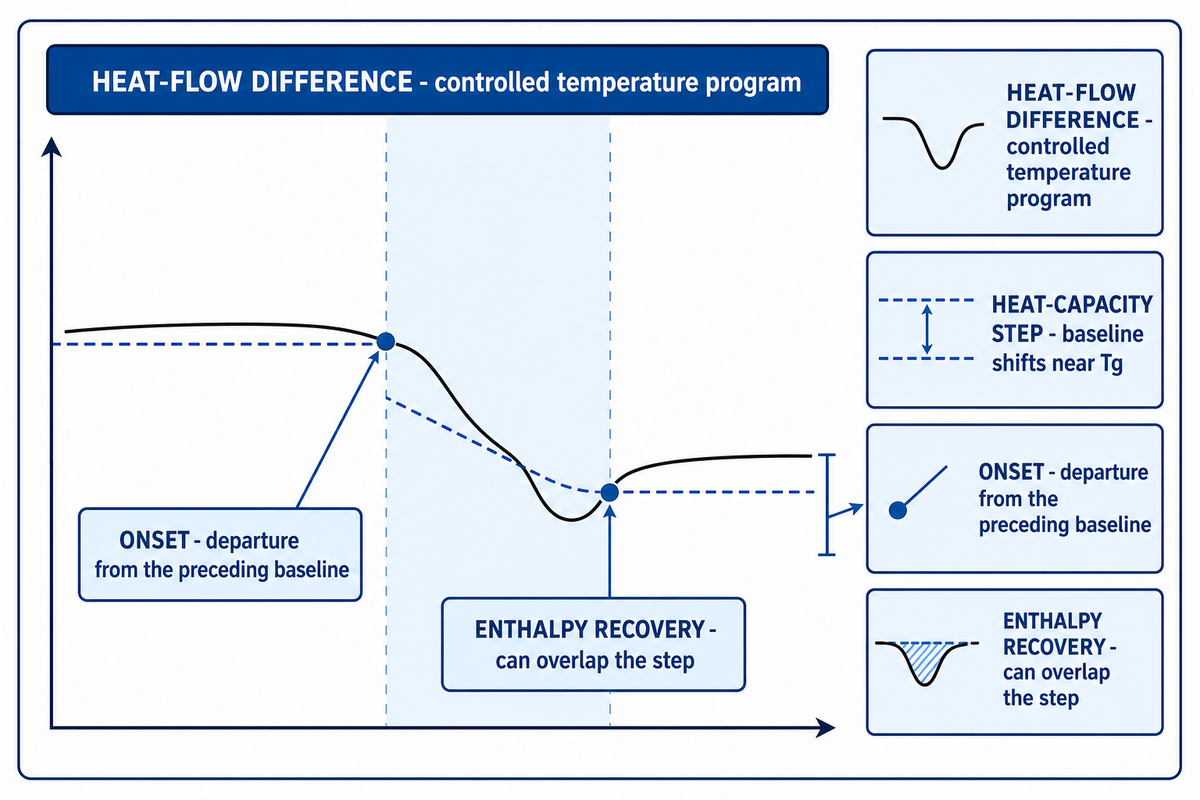
Differential scanning calorimetry measures heat flow under a differential temperature program. The baseline will shift near the glass transition temperature. The heat capacity changes during the glass transition. Analysts establish a baseline on either side of the transition and create a rule to determine a point or interval between the two baselines to identify the glass transition temperature.
There are a number of definitions used in Thermal Analysis. Not all are interchangeable. For example, onset is the place on a thermogram (or DSC trace) where the temperature or enthalpy rise starts, and ends where the process is completed. The midpoint defines the point where the process is at its highest or lowest, and inflection is the point where a bend occurs in a process (usually a change in direction). Endpoint indicates where the process has come to completion, usually the reverse of an onset process.
The official catalogue record for ISO 11357-2:2020 identifies edition 3, notes its 2025 confirmation, and describes differential scanning calorimetry methods for glass-transition temperature and step height in amorphous and partially crystalline plastics. Citing that scope does not claim that Tengyang is certified to the standard or operates an accredited laboratory.
Physical aging can complicate the trace. Storage below Tg can allow a trace to relax to a more stable state. When it is reheated, enthalpy recovery may overlap the heat-capacity step. A peer-reviewed DSC study of an amorphous pharmaceutical specimen illustrates this effect and uses fictive temperature as an analysis concept. It does not establish a second universal Tg or a value transferable to another polymer.
Why Dynamic Mechanical Analysis Can Report a Different Tg
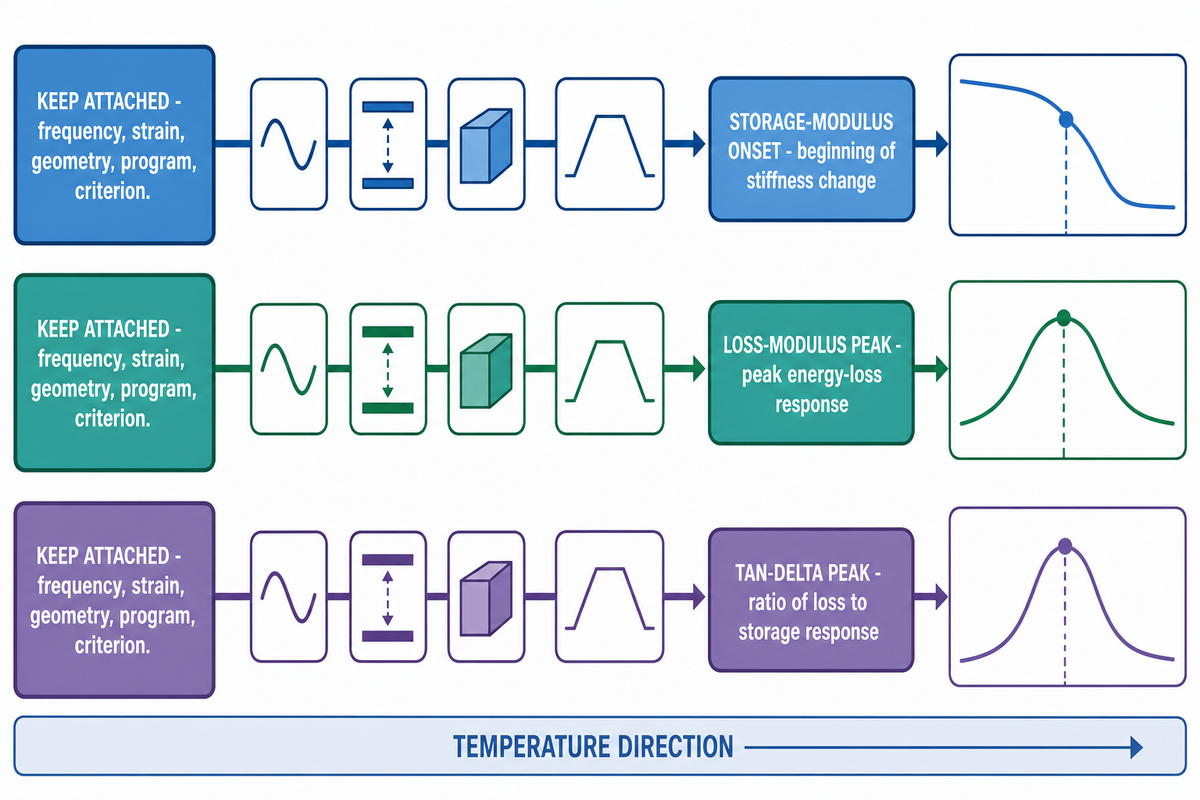
Dynamic mechanical analysis can report a different Tg because it follows frequency-dependent mechanical response, while differential scanning calorimetry follows a heat-capacity change. Storage-modulus onset, loss-modulus peak, and tan-delta peak are separate criteria, so each result needs its frequency, strain, geometry, temperature program, and stated criterion.
Dynamic mechanical analysis can report a different Tg because it follows frequency-dependent mechanical response, while differential scanning calorimetry follows a heat-capacity change. Storage-modulus onset, loss-modulus peak, and tan-delta peak are separate criteria, so each result needs its frequency, strain, geometry, temperature program, and stated criterion.
Why do DSC and DMA give different Tg values?
Differential scanning calorimetry records thermal events. In dynamic mechanical analysis, a specified mechanical load is applied in an oscillatory or periodic fashion and the ensuing mechanical response is measured. Storage-modulus onset and loss-modulus peaks may occur at different temperatures; the tan delta peak may also shift.
| Method or criterion | Observed signal | Context that must stay attached | Interpretation boundary |
|---|---|---|---|
| DSC onset or midpoint | Heat-capacity baseline step | Cycle, direction, rate, conditioning, criterion | Not a mechanical failure temperature |
| DMA storage-modulus onset | Beginning of stiffness change | Frequency, strain, mode, geometry, rate | Not interchangeable with a peak |
| DMA loss-modulus peak | Peak energy-loss response | Frequency and specimen evolution | Not every peak is the primary alpha relaxation |
| DMA tan-delta peak | Ratio of loss to storage response | Same full method context | No universal conversion to DSC midpoint |
| DSC first-heating step | Heat-capacity response with prior processing and storage history | Conditioning, pan, mass, direction, and rate | May not match a history-erased second heat |
| DSC second-heating step | Heat-capacity response after the declared laboratory cycle | Complete first-cycle and cooling program | Does not reproduce every production history |
| Thermomechanical or dilatometric criterion | Dimensional or expansion response | Load, geometry, direction, and heating program | Not interchangeable with a calorimetric midpoint |
| Dielectric relaxation criterion | Frequency-dependent electrical relaxation | Frequency range, electrode setup, and specimen | Another observation window, not a conversion formula |
A peer-reviewed DSC and DMA comparison reported method-specific differences for two materials. It also supplies a useful counterexample: within the tested HPMC rates of 5 °C/min and 10 °C/min and frequencies of 0.1 Hz, 1 Hz, and 10 Hz, the study did not find a statistically significant difference for that strong-glass specimen. The lesson is not that rate and frequency never matter. It is that their effect must be demonstrated for the material and range instead of asserted as universal.
Comparison limited to the cited study: The conditions listed in the cited study are conditions for the specimens studied, and are not conditions recommended for tests on Tengyang products.
| Study evidence class | Material or setting | Method or reported value | Use boundary |
|---|---|---|---|
| Method comparison | HPMC | MDSC: 173.0 °C, reported spread ±6.4 °C | Study specimen only |
| Method comparison | HPMC | DMA: 175.0 °C, reported spread ±4.4 °C | Criterion and study conditions retained |
| Method comparison | Felodipine | DSC: 45.0 °C, reported spread ±2.7 °C | Not transferable to another chemistry |
| Method comparison | Felodipine | DMA: 50.0 °C, reported spread ±0.7 °C | Not a universal DSC-to-DMA offset |
| Rate check | HPMC | 5 °C/min | One tested scan rate |
| Rate check | HPMC | 10 °C/min | One tested scan rate |
| Frequency check | HPMC | 0.1 Hz | One tested frequency |
| Frequency check | HPMC | 1 Hz | One tested frequency |
| Frequency check | HPMC | 10 Hz | One tested frequency |
The study indicates that the effect observed is within a frequency window of 0.1 Hz to 10 Hz. This is true for this study and not for other similar products.
Secondary beta and gamma relaxations can appear below the primary alpha transition. A review of PLA in dynamic mechanical analysis also shows that enthalpic relaxation, shrinkage, orientation, and cold crystallization can overlap a temperature sweep. In such a case the instrument may be observing a specimen that is evolving during the run, not a perfectly passive transition.
Factors That Shift the Reported Transition
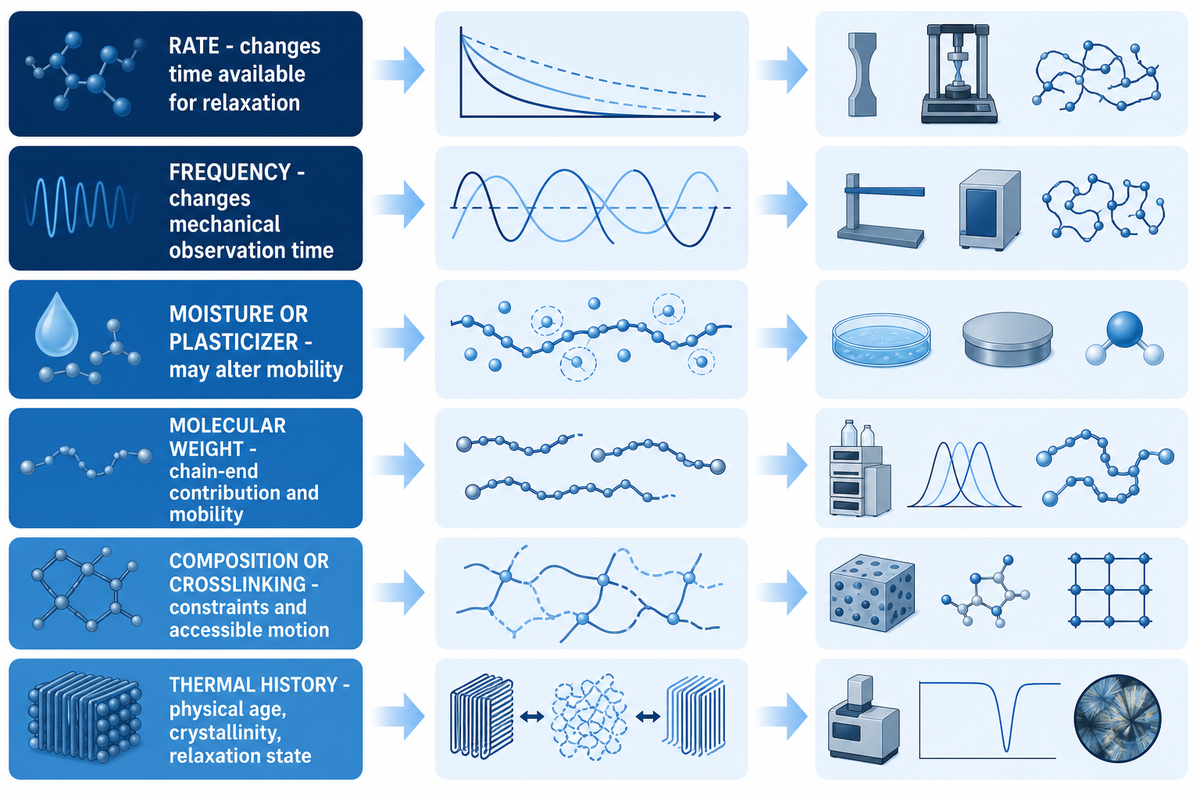
Variables that affect transition temperature (Tg) include the method used to determine Tg (e.g. geometry, chemical composition, history of sample, test conditions), the sample’s physical state, and the duration of the test. Changes in these conditions may result in apparent changes in Tg in the same direction or in the opposite direction. For example, one sample may lose water, and as a consequence, become more plastic, while in another sample, water may be bound in hydrogen bonding and, therefore, strengthen the sample. Because of these uncertainties, each report of a Tg measurement should be interpreted with caution.
| Factor | Possible molecular or specimen effect | Possible signal consequence | Evidence still required |
|---|---|---|---|
| Heating or cooling rate | Changes the time available for relaxation | Shifted or broadened transition | Matched scans on the same specimen system |
| Oscillation frequency | Changes the mechanical observation time | Criterion-dependent movement | Frequency sweep and declared criterion |
| Moisture or plasticizer | May alter mobility and intermolecular interactions | Shift, broadening, or multiple features | Conditioning record and composition |
| Molecular weight | Changes chain-end contribution and mobility | Chemistry- and range-dependent change | Comparable chemistry and molar-mass distribution |
| Copolymer composition or crosslink density | Changes constraints and accessible motion | Shift or altered breadth | Composition, conversion, and morphology |
| Thermal history and anneal | Changes physical age, crystallinity, and relaxation state | Enthalpy recovery or different baseline | First/second heat comparison and conditioning |
| Crystallization conditions | Change mobile and constrained amorphous fractions | Changed step size, breadth, or overlap | Morphology evidence, not Tg alone |
Amorphous and Semi-Crystalline Polymers Around Tg

For Amorphous material, the Tg corresponds to the transition of the amorphous fraction. It may be noted that in semi-crystalline polymers, the remaining amorphous regions may be constrained by the crystalline phase, thus imparting some structure to the material. Thus, material of this kind may exhibit changes in sor juris and/or elasticity, even at temperatures far below its Tg.
For PET and PBT, a peer-reviewed three-phase analysis distinguishes mobile-amorphous, rigid-amorphous, and crystalline fractions. Their proportions depend on crystallization conditions and thermal history. That model helps explain why “percent crystalline plus percent amorphous” can be too simple, but the reported fractions must not be transferred to other polymers or to a Tengyang grade.
Terms such as ‘neat resin’ or ‘filled grade’ specify a material. Other modifications such as plasticization or conditioning of a material result in a different material. Morphology of a material may affect Tg. The role of the constituents of a material should be determined in relation to the family of the polymer for a given grade.
Engineering Decisions Tg Cannot Make Alone

Tg can detect temperature-related responses, but it can’t determine ultimate service temperature, long term stability, fatigue, durability, adhesion, chemical resistance, or acceptability. Factors such as stress, geometry, environment (moisture, cycling, aging), failure, and test criteria are to be considered when evaluating service limits.
Usually, higher Tg values are preferred. However, a harder material may not be adequate for the application. The adhesive may require fluidity and mobility of the adhesive polymer to achieve the desired functionality. An adhesive material having higher Tg value may not be the correct choice.
Once the educational boundary is clear, readers with an actual substrate pair, processing window, and end-use environment can apply Tg data to a hot-melt adhesive enquiry. That solution page handles application context; this guide does not provide samples, prices, quotations, lead times, report interpretation, or grade recommendations.
Five Conclusions a Tg Number Cannot Support
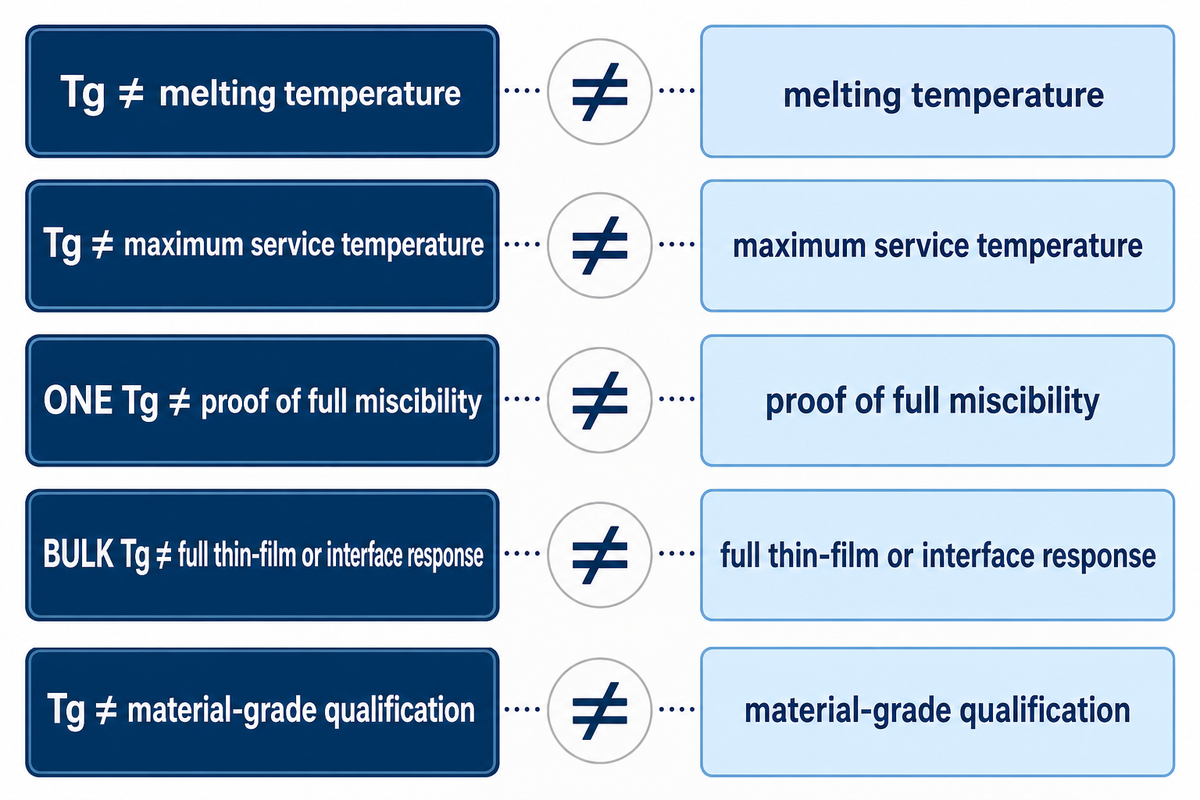
A claim involving Tg values may be challenged by the Five Non-Equivalences of Tg.
| Tempting inference | Why it fails | Separate evidence needed |
|---|---|---|
| Tg equals melting temperature | Amorphous mobility and loss of crystalline order are different events. | A declared melting or crystallization method and morphology context |
| Tg equals maximum service temperature | Load, time, geometry, environment, ageing, and allowable deformation remain unknown. | Application-relevant creep, durability, and failure criteria |
| One Tg proves full miscibility | Close or overlapping transitions can hide heterogeneity. A bounded SEBS/polystyrene study reported phase-separated aggregates together with a single Tg for the PS phase. | Matched morphological and compositional evidence |
| Bulk Tg fully describes a thin film or interface | Confinement and interfaces can alter local response. A NIST-hosted ultrathin-film study provides a specific example, not a universal direction. | Geometry- and interface-relevant characterization |
| Tg qualifies a material grade | Processing, adhesion, durability, chemical exposure, and failure mode remain application-specific. | Grade-specific tests against a defined acceptance plan |
What 2025 Transition-Zone Prediction Adds—and What It Does Not
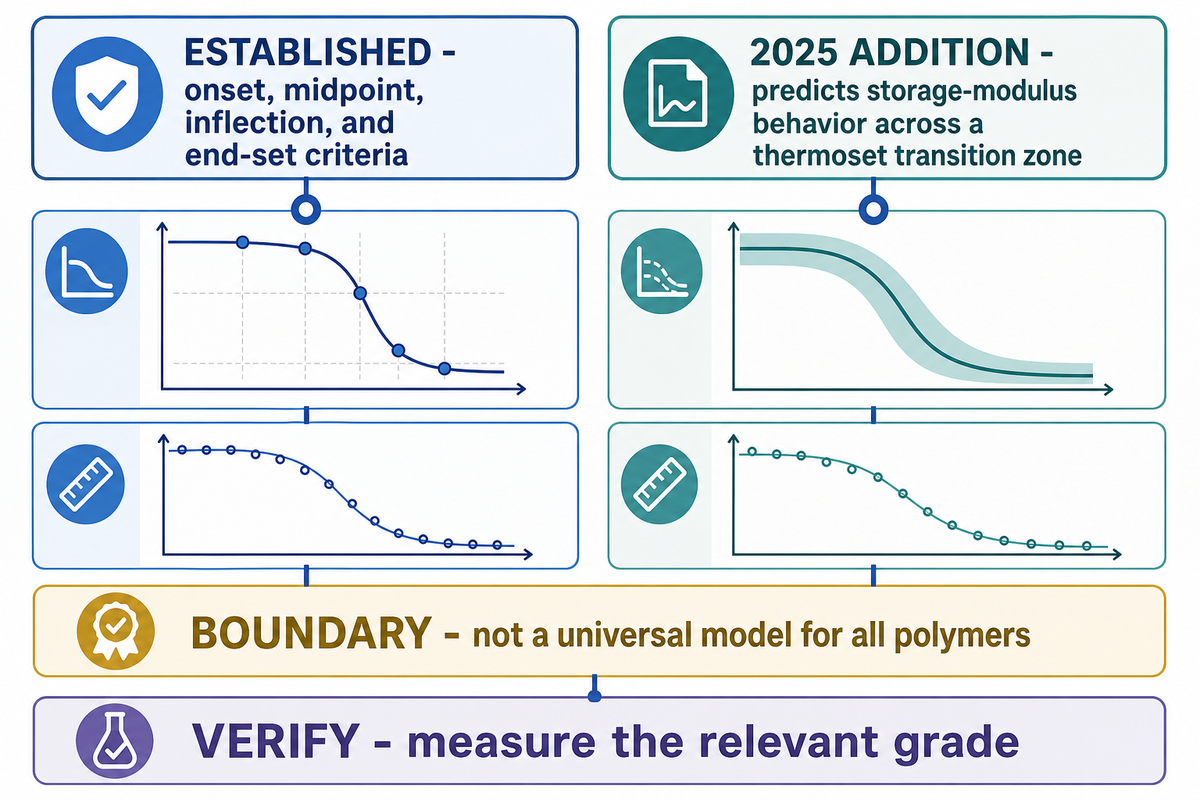
Interpreting glass transitions as ranges did not begin in 2025. The method, specimen, and measurement criterion still need to stay attached to any reported value. A 2021 peer-reviewed review already discusses onset, midpoint, inflection, and end-set criteria and the factors that affect reported values.
The narrower contribution of a 2025 Journal of Physical Chemistry B paper is a method for predicting storage-modulus behavior across a thermoset transition zone. The authors validate predicted curves for four new polymers across three classes. That is a bounded modelling result, not discovery that Tg is a range, not a universal model for all polymers, and not evidence that an unmeasured commercial grade will follow a predicted curve.
Prediction is often more practical than experimental verification and may help identify data gaps. However, to fully verify a design, an experiment involving a measurement on the relevant grade must be performed.
Glass Transition Temperature FAQs
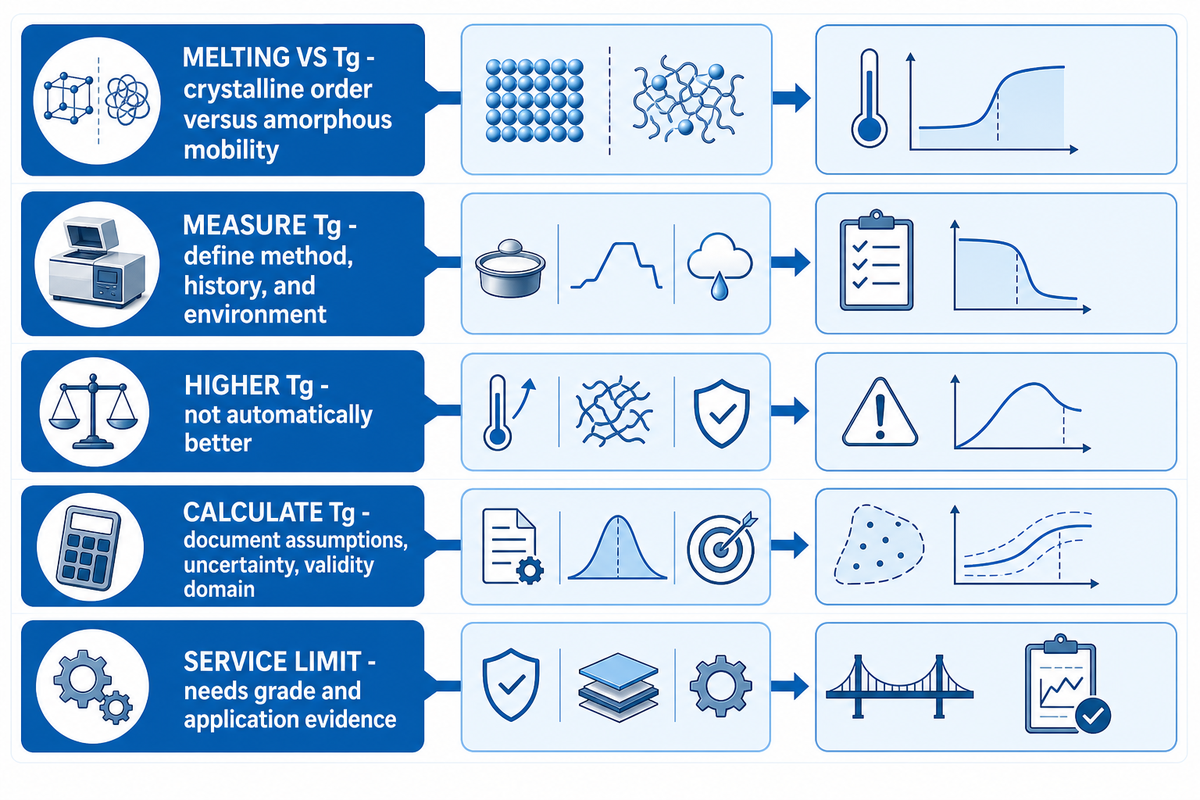
What is the difference between melting temperature and glass transition temperature?
melting temperature shows that polymers with amorphous regions may exhibit storage-modulus behavior. However, the presence of amorphous regions does not guarantee Tg. Similarly, the absence of a crystalline melting peak does not preclude Tg. The presence of both Tg and a crystalline melting peak may be found in some semi-crystalline polymers.
During design, caution should be used when using methods in conjunction with each other. Similarly, storage-modulus behavior should not be considered in the presence of Tg.
How is glass transition temperature measured?
Glass transition temperature is evaluated by several methods. Differential scanning calorimetry (DSC) can be performed following a heat capacity determination. Mechanical response measurements can be made with dynamic mechanical analysis (DMA). Dielectric, thermal expansion and other related phenomena can also be used. Because measured properties vary, sample history and environment must be defined for each method.
Is a higher Tg always better?
No. Higher Tg may help at elevated temperatures, but service performance also depends on load, time, geometry, environment, ageing, and allowable deformation. Higher Tg also does not automatically indicate better mechanical properties, a rubbery response, or rigidity. This distinction matters for material selection.
How do I calculate glass transition temperature?
Theory-based methods (mixture equations, group-cont contribution methods, molecular simulation, and structure-based methods) can be used to estimate Tg. Assumptions may include constituent distribution (i.e., molecular structure and/or architecture), conversion, and/or empirical data. Where applicable, interpret the result within the context of prediction versus measurement. Compare the prediction with a measured sample representing the thermal history of interest. A calculation may be helpful to plan and prioritize downstream experiments, but such calculations should not be misinterpreted as validation for commercial release.
Can Tg determine a polymer’s maximum service temperature?
No single factor. Service limits depend on multiple factors including load, duration, shape, creep, age, humidity, thermal and chemical exposure, allowable deflection and failure type. The Tg of a polymer can be used to develop a screening scheme; however, for a real-world application, the limits of the polymer, along with Failure Mode Effect Analysis (FMEA), will define the acceptance criteria.
Discuss a Defined Hot-Melt Bonding Requirement
Shanghai Tengyang New Materials Technology Co., Ltd. produces TPU, EVA, PA, PES, and PO hot-melt adhesives in various forms including films, webs, powders and granules. Provide the substrate pair, adhesive type and the bonding mechanism with temperature, pressure, dwell and other relevant conditions.
Contact Betty Fang at Betty@hotmeltmaterial.com or WhatsApp +86 131 2223 3268.
References & Sources
- NIST, Glass Transition: Its Measurement and Underlying Physics
- ISO catalogue record for ISO 11357-2:2020
- Peer-reviewed comparison of DSC and DMA glass-transition measurements
- Peer-reviewed review of glass-transition measurement criteria and variables
- Peer-reviewed SEBS/polystyrene blend study used for the miscibility boundary
- Peer-reviewed PET/PBT three-phase analysis
- Peer-reviewed PLA dynamic mechanical analysis review
- Peer-reviewed physical-aging and enthalpy-recovery study
- 2025 thermoset transition-zone prediction study
- NIST-hosted ultrathin-film glass-transition study
Boundaries on evidence: Tengyang certifications, patents, and test data are not published herein. Grade data and performance guarantees are not provided. Only stable definitions are given by older documents. Current regulatory requirements and Tengyang performance are not reflected by older documents. The brand information is provided in the company section. No grade-specific Tg values are given in the information presented herein.
ABOUT TENGYANG
Industrial hot melt adhesive materials for bonding routes
Shanghai Tengyang New Materials Technology Co., Ltd. supports material discussions for production teams working with bonded products.
Available forms: hot melt adhesive film, web, powder and granules. Material families: TPU, EVA, PA, PES and PO.
CONTACT PROFILE
Betty Fang
Contact for material inquiries.