Get in touch with Tengyang Company

Intrinsic Viscosity: Dilute-Solution Measurements and Polymer Size

Intrinsic viscosity describes how much a dissolved polymer modifies a solvent’s viscosity per unit polymer concentration as that concentration approaches zero. It connects dilute-solution measurements to molecular size, but a result like 0.80 dL/g only becomes meaningful in context of the polymer, solvent, temperature and calculation method.
A laboratory can measure many different viscosity quantities from the same solution. Confusing them can lead to a poor material decision. For example, a more viscous solution can describe a different chain environment rather than a better adhesive. A melt measurement adds yet another distinction. It describes flow without the dilute solvent environment. This reference deals with extrapolation, shows what two extrapolation plots can represent and offer, and gives a practical way to compare reports for polyester and copolyester materials.
Always start with the quantity. Intrinsic viscosity is a limiting value, inherent viscosity is a finite-concentration logarithmic quantity, and melt viscosity describes molten flow. Match the quantity and conditions to interpret a difference between lots.
What intrinsic viscosity measures in a dilute solution
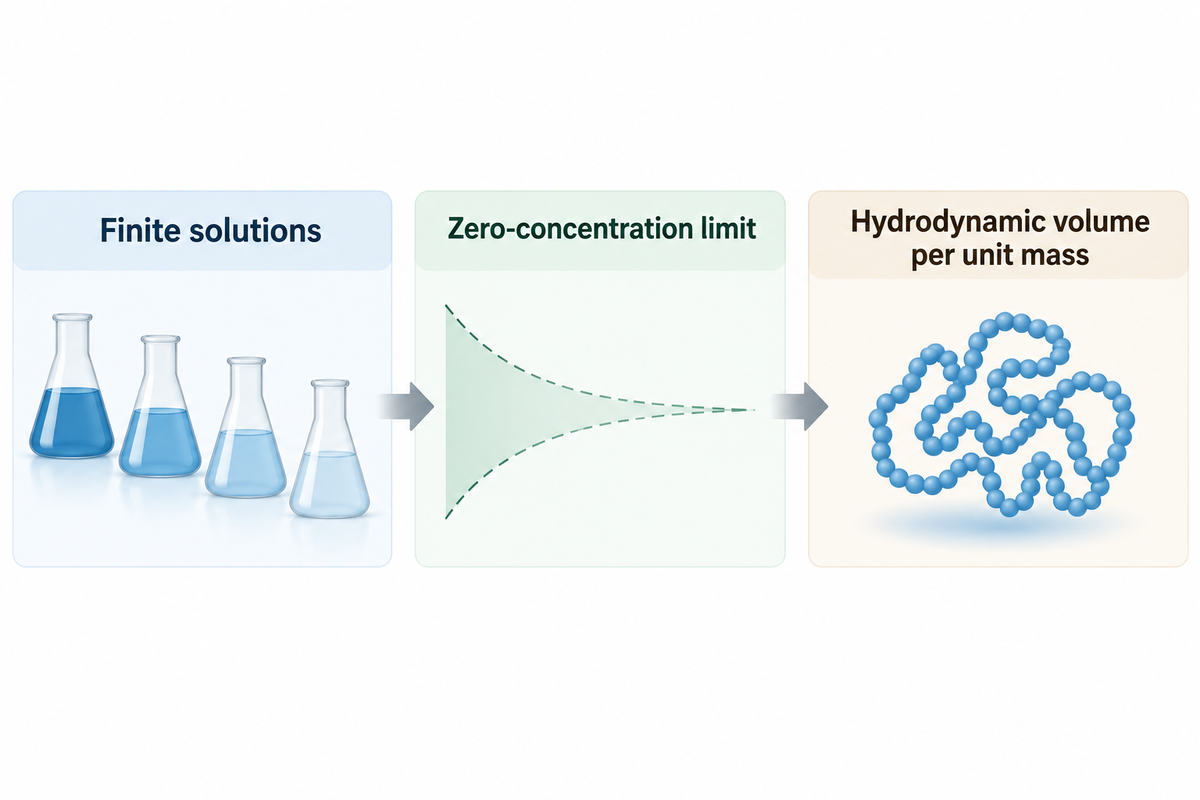
Intrinsic viscosity represents the contribution of a polymer to the solution viscosity at infinite dilution, normalized by polymer mass concentration. Its physical meaning concerns hydrodynamic volume per unit mass. Larger, more expanded chains can interact with flow more and disturb it more. However, solvent interactions and different chain architectures can alter the response even when the material name remains the same.
The IUPAC definition of intrinsic viscosity uses the limiting value of either reduced or inherent viscosity as concentration tends to zero. Infinite dilution is a mathematical limit. A laboratory measures finite solutions and estimates that limit through a stated procedure; it doesn’t time an individual polymer molecule in a solvent-free vacuum.
Stephen E. Harding describes this traditionally named quantity as “not a true viscosity at all”.
Hydrodynamic sizes are relative to mass. Tulane University’s polymer characterization laboratory explains the role of intrinsic viscosity in a hydrodynamic-volume calibration. A chain’s spatial extent and its mass are related, but the measurement is not a direct ruler reading of coil diameter. Nor does one viscosity result describe the full distribution of molecular sizes in a commercial sample.
For a quality engineer, the useful comparison is a controlled trend within a defined material system. An isolated high value shouldn’t automatically outrank a lower value from another polymer or solvent. The broader polymer physics behind adhesive bonding also includes conformation, relaxation and thermal response; each describes a different part of the material’s behavior.
A report of 0.80 dL/g corresponds to 80 cm³/g. Both express the same limiting quantity, whereas 0.80 Pa·s expresses a dynamic viscosity. Keeping the units visible prevents a numerical match from being mistaken for a physical match, especially when reports arrive from different laboratories.
Relative, specific, reduced and inherent viscosity
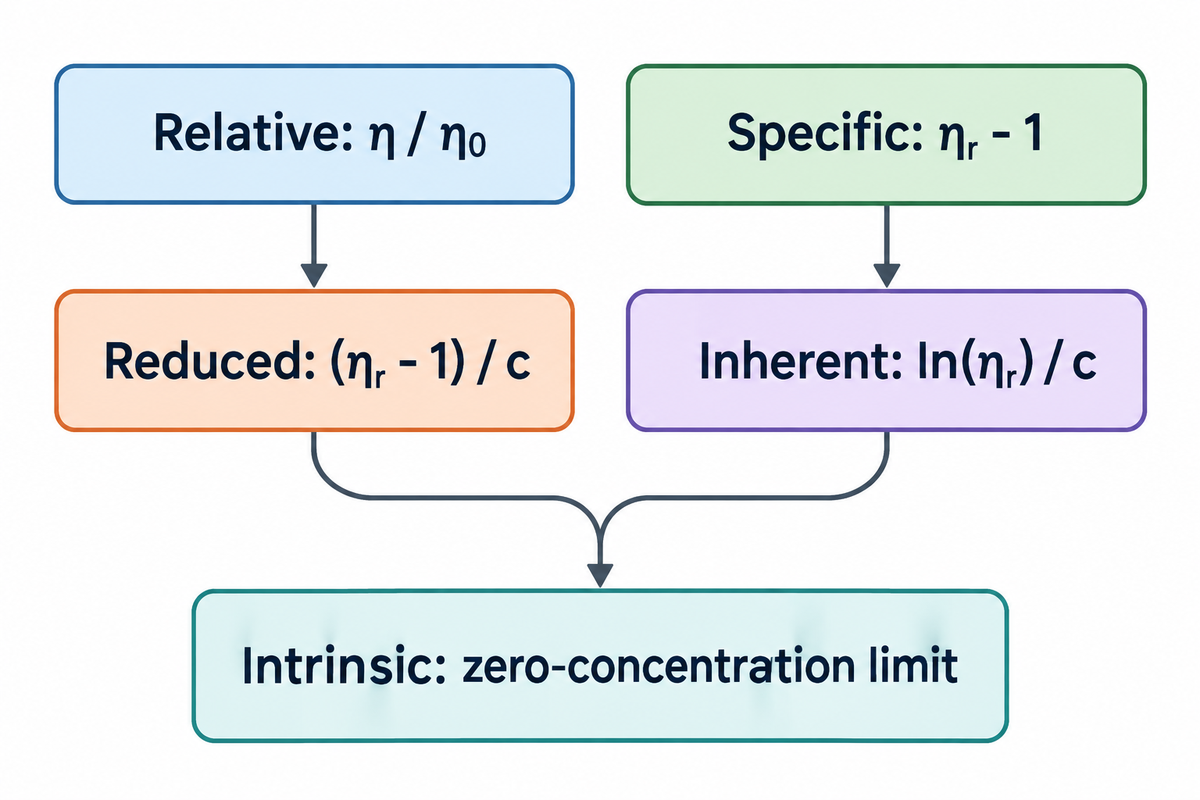
Relative viscosity measures the dynamic viscosity of a solution versus its solvent viscosity under the same conditions. Specific viscosity is derived by subtracting 1 from the above measure. Dividing specific viscosity by polymer mass concentration gives reduced viscosity. The natural log of Relative viscosity divided by polymer mass concentration gives the inherent viscosity. Only the appropriate zero-concentration limit is intrinsic viscosity.
Use η for solution viscosity, η₀ for solvent viscosity and c for mass concentration. The log is in its natural form. The IUPAC inherent-viscosity entry differentiates logarithmic viscosity numbers from a dimensionless viscosity ratio.
| Quantity | Expression | Units when c is g/dL | What is being reported? |
|---|---|---|---|
| Relative viscosity, ηᵣ | η / η₀ | Dimensionless | Solution-to-solvent ratio |
| Specific viscosity, ηsp | ηᵣ − 1 | Dimensionless | Fractional increase in viscosity |
| Reduced viscosity, ηred | (ηᵣ − 1) / c | dL/g | Finite-concentration ordinate |
| Inherent viscosity, ηinh | ln(ηᵣ) / c | dL/g | Finite-concentration logarithmic ordinate |
| Intrinsic viscosity, [η] | lim c→0 ηred = lim c→0 ηinh | dL/g | Infinite-dilution limiting value |
What is the difference between inherent and intrinsic viscosity?
Inherent viscosity is ln(ηᵣ)/c at a given finite concentration; intrinsic viscosity is its limiting value as c approaches zero. They may share the same dL/g unit and still be different. Reporting a single inherent viscosity value requires stating the concentration. An intrinsic viscosity value requires stating the extrapolation or estimation method used to obtain it.
In Capillary viscometry, the flow times provide raw observations. Treating ηᵣ as t/t₀ requires the method’s density and instrument corrections to be appropriate. Generally, a dynamic viscosity ratio also involves the solution and solvent densities. A lab’s validated procedure should settle those corrections before the derived quantities enter a regression.
Example: at c = 0.40 g/dL and ηᵣ = 1.3712, specific viscosity is 0.3712. Reduced viscosity is 0.3712/0.40 = 0.9280 dL/g. Inherent viscosity is ln(1.3712)/0.40 = 0.7892 dL/g. The difference of 0.1388 dL/g is due to the definitions, not two different polymer samples.
Concentration units carry directly into the answer. Entering 0.40 g/dL as 0.40 g/mL changes the physical concentration by a factor of 100. A spreadsheet can still create nice looking curves after making such an error. Unit agreement should occur in the calculation itself.
Zero-concentration extrapolation with Huggins and Kraemer plots
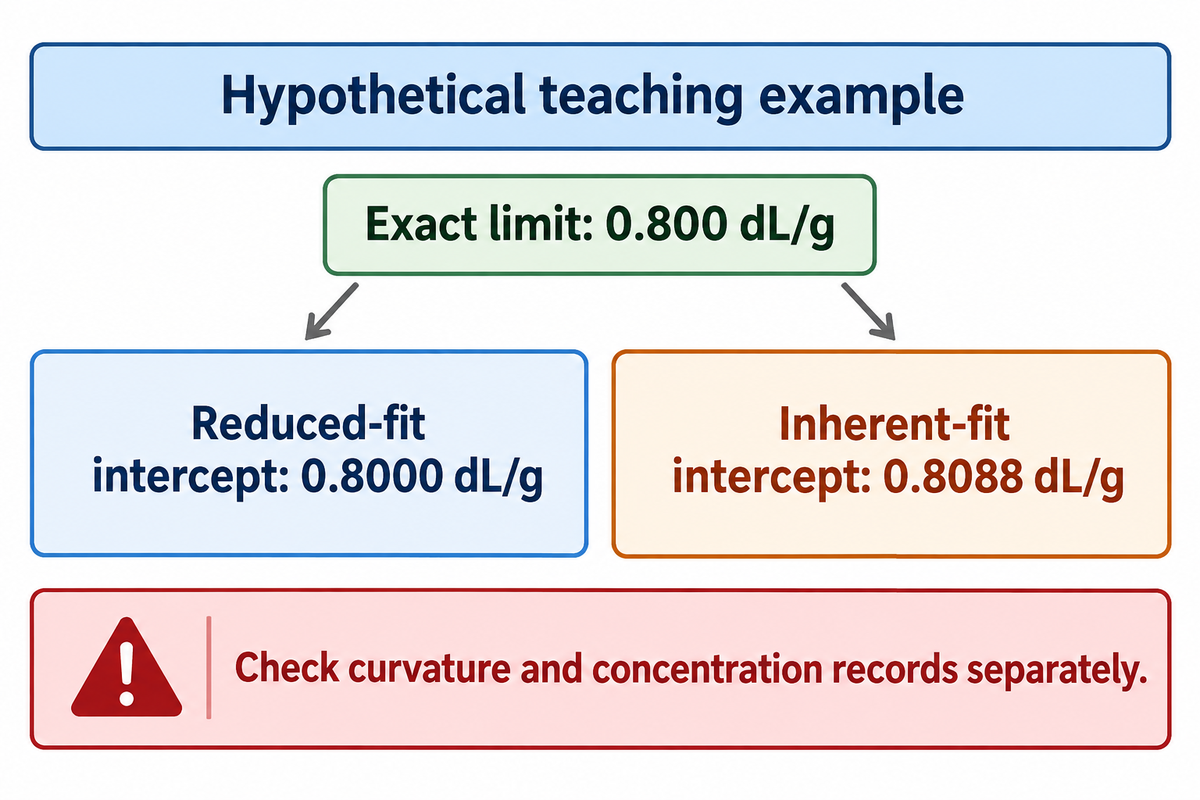
Huggins and Kraemer plots estimate intrinsic viscosity from reduced and inherent viscosity measured at different concentrations. Both ordinates have the same exact limit at zero concentration. Straight-line fits to both plots may have different intercepts due to concentration errors, measurement uncertainty and omitted curvature. Agreement is an internal check.
How is intrinsic viscosity measured?
Measure a solvent blank and completely dissolved polymer solutions at different concentrations at a controlled temperature. Convert the observations into relative viscosity, calculate reduced and inherent viscosity for each concentration, then fit a suitable dilute-range model and extrapolate to zero concentration. Report the fitted value with units, conditions, fitting choices and the method’s uncertainty.
The first-order Huggins form is ηred = [η] + kH[η]²c. The IUPAC Kraemer equation writes ηinh = [η] + kK[η]²c with a signed Kraemer coefficient. Some texts place a negative sign in front of a positive coefficient. Comparing coefficient signs requires checking the convention, while the common intercept remains [η].
Twin-Intercept Consistency Plot: a complete calculation
Example: fix the polymer and solvent and the temperature and use the hypothetical relation ηᵣ = 1 + 0.8c + 0.32c², where c is expressed in numeric terms in g/dL. This illustrates the limiting value is 0.800 dL/g. The calculations also expose why an attractive pair of fitted lines need not meet exactly.
| c, g/dL | ηᵣ | ηred, dL/g | ηinh, dL/g |
|---|---|---|---|
| 0.20 | 1.1728 | 0.8640 | 0.7970 |
| 0.40 | 1.3712 | 0.9280 | 0.7892 |
| 0.60 | 1.5952 | 0.9920 | 0.7783 |
| 0.80 | 1.8448 | 1.0560 | 0.7655 |
Ordinary unweighted linear regression through all four points gives 0.8000 dL/g with the reduced-viscosity intercept and 0.8088 dL/g with the inherent-viscosity intercept. The slope of the inherent viscosity line is about −0.05270 (dL/g)². The logarithmic curve contains higher order terms. Therefore, a straight line over this finite interval is only an approximation.
The four residuals for the inherent fit are approximately −0.00134, +0.00145, +0.00111, and −0.00122 dL/g. Curvature is shown by the pattern of the residuals. It would be best to examine the concentration window and method, rather than attempt to force the intercepts to agree or average them automatically.
Consider a second analysis in the same quality review. Each reported concentration is 10% too high, due to using the incorrect solution volume for the dilution calculation. Both limiting values can agree with each other while underestimating the true value by about 9.09%. Both ordinates divide by that same inflated c, so both limiting values shift by the same factor: 0.800/1.10 = 0.7273 dL/g. Repeating flow time measurements can’t eliminate this common error. The analyst needs an independent check of mass and volume records, as well as a residual plot. A paired plot is useful, because it tests the consistency of transformations of the data; however, it can’t turn transformations of the data into independent measurements.
A four-point series from 0.20 to 0.80 g/dL can illustrate extrapolation without defining a recommended concentration window for every polymer. The 0.8000 and 0.8088 dL/g intercepts differ because one finite fit neglects curvature. Choice of model, and the accuracy of the concentrations and solvent blanks remain separate checks, and can be examined even if plotted lines give the impression of agreement.
Solvent, temperature and polymer conformation
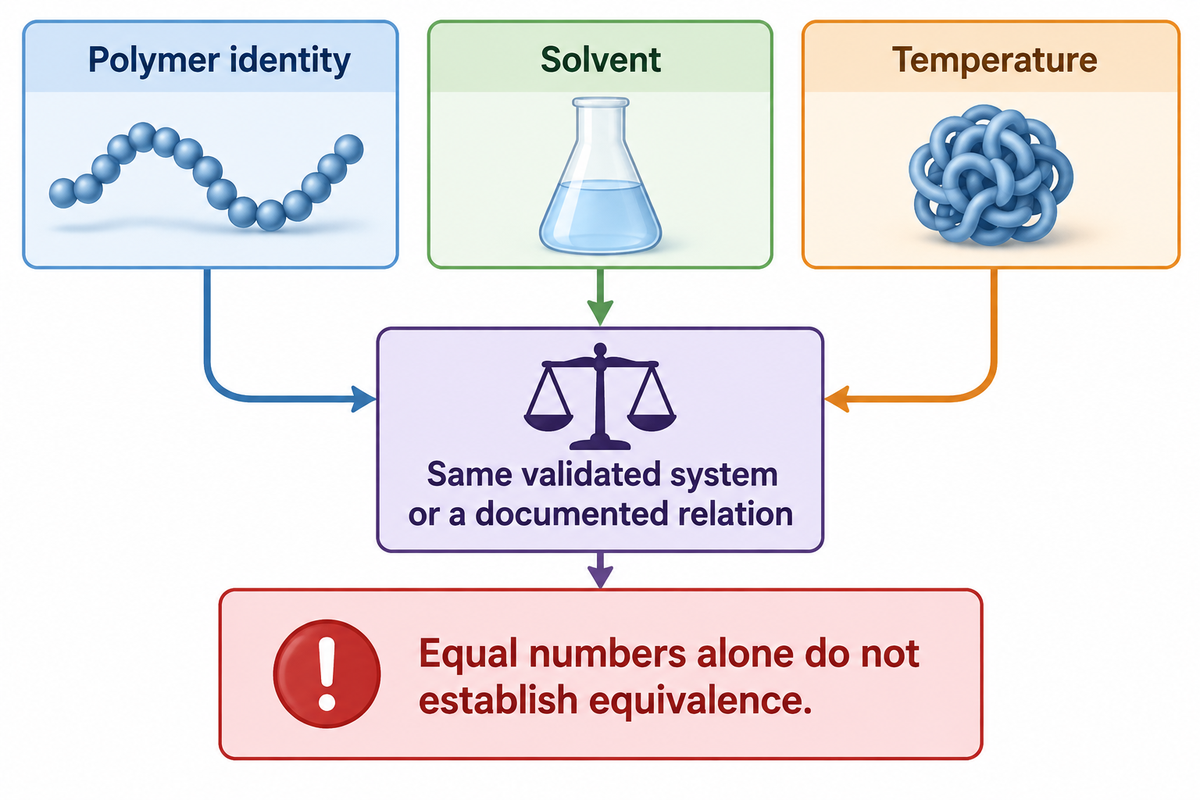
Solvents and temperatures affect the conformation of a polymer coil and its interaction with surrounding solvent molecules. Thus, intrinsic viscosity belongs to a defined polymer-solvent-temperature system. Two values measured in different environments can’t be ranked as a molecular-size change until the effect of the environment and relevant calibration are resolved.
Temperature changes solvent viscosity and thermodynamic interactions. Molecular interactions between polymer and solvent affect conformation. Good and poor solvent conditions alter how extended a dissolved chain becomes. For polyethylene terephthalate (PET), organic solvents can be used in the appropriate method. For a different polymer, a different compatible solvent may be required. Aqueous polyelectrolyte solutions add ionic-strength effects. These can explain why the same macromolecule can give different solution viscosity without an equivalent change in the chemical length of its polymer chains.
ASTM D2857-22, dilute-solution viscosity of polymers calls for solvent and temperature to accompany the result. It shows why molecular-weight correlations are constrained by chemistry and branching. Matching a certain resin name is just a beginning.
Architecture adds another layer. The National Institute of Standards and Technology’s Macromolecular Architectures project describes different solution-chain extension for block and statistical polyolefin copolymers with the same composition. Monomer sequence and branch distribution can affect conformational response. That polyolefin finding illustrates the structural issue; it isn’t a copolyester-film performance value.
Example: A procurement team gets two reports for the same named grade, each showing 0.80 dL/g. One uses a specified solvent at 25°C, and the other uses a different solvent at 30°C. Approving equivalence from the matching number would dismiss the conditions that define it. The sensible procurement comparison uses the same validated measurement system or a documented relation between systems. If the grade’s architecture or composition also changes, matching test conditions alone would still leave a material difference to evaluate. Price comparison becomes relevant once the reports express a common quantity under comparable conditions, rather than once the two headline numbers happen to match.
Related rate and temperature effects in viscoelastic materials concern bulk behavior. Solution conformation is a different mechanism. Separating the two helps an engineer interpret a change without attributing every flow and bonding effect to molecular weight.
Equal readings of 0.80 dL/g at 25°C and 30°C are not automatically interchangeable. Differing solvents and chain conformations can offset one another. To establish a meaningful trend, the validated conditions are kept constant and alterations in the composition or architecture are treated as different variables rather than converting temperature using a general correction factor.
From intrinsic viscosity to viscosity-average molecular weight
The Mark-Houwink equation relates intrinsic viscosity to molecular mass through constants determined by a particular polymer, solvent and temperature. For a polydisperse sample, the result usually concerns the viscosity average molecular mass. It isn’t automatically the number-average or weight-average molecular mass, and a single calibration need not cover every molecular-weight range.
The IUPAC Mark-Houwink entry gives [η] = K Mᵣᵃ using relative molecular mass. Engineering expressions usually employ molar mass instead. Those conventions require a different approach to the constant’s units, so a tabulated K must travel with its mass and viscosity units. The exponent also belongs to that calibrated system.
How does molecular weight affect viscosity?
Within a matched, calibrated polymer system, increasing molecular weight raises intrinsic viscosity in proportion to M to the power a in the applicable Mark-Houwink relationship; for most polymer systems a lies between 0.5 and 0.8. Changing branching, chemistry or solvent can change that relationship. Bulk melt viscosity adds shear and temperature effects, so a solution-based mass trend should not be read as a universal prediction of molten flow.
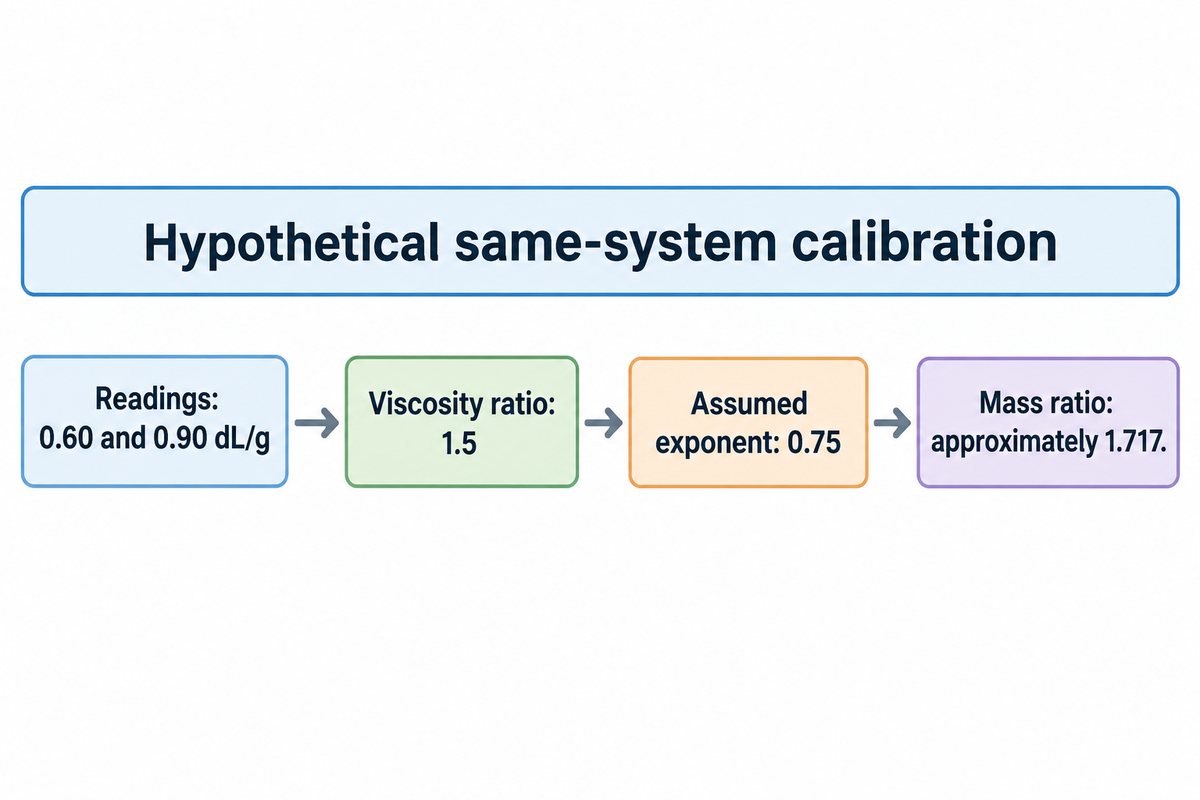
Example: Suppose a valid same-system calibration has a = 0.75 and two intrinsic-viscosity values are 0.60 and 0.90 dL/g. Their ratio is 1.5. The viscosity-average molecular-mass ratio is 1.5^(1/0.75) = approximately 1.717. K cancels out because the same valid calibration is applicable to both the samples. In the absence of K, its units and its validity range, no absolute molecular mass is found.
Number-average mass, Mₙ, weights chains by number; weight-average mass, M𝑤, emphasizes heavier chains differently. Viscosity-average mass, Mᵥ, has the weighting associated with the viscometric relationship. An averaging method without a name leaves a report incomplete. A broad distribution can change these averages by different amounts.
Frank L. McCrackin’s 1987 study reported a case where Mark-Houwink didn’t fit the complete molecular-weight range. That’s a useful calibration warning, not a reason to abandon every valid application. A particular polymer, such as polypropylene, requires its own appropriate relationship for a particular solvent; constants from PET can’t simply migrate to it or to an arbitrary copolyester.
For characterization across a distribution, multi-detector size-exclusion chromatography can combine viscometry with concentration and light-scattering information. Its separation and detector assumptions still matter. Choose this if the information required by the decision can’t be supplied by a single bulk intrinsic-viscosity measurement.
Raising a matched-system reading from 0.60 to 0.90 dL/g gives a ratio of 1.5, not a 50% molecular-mass increase by definition. With the assumed exponent 0.75, the calculated mass ratio is about 1.717. A valid different exponent changes that, but the viscosity readings remain the same.
Intrinsic viscosity vs melt viscosity for adhesive films
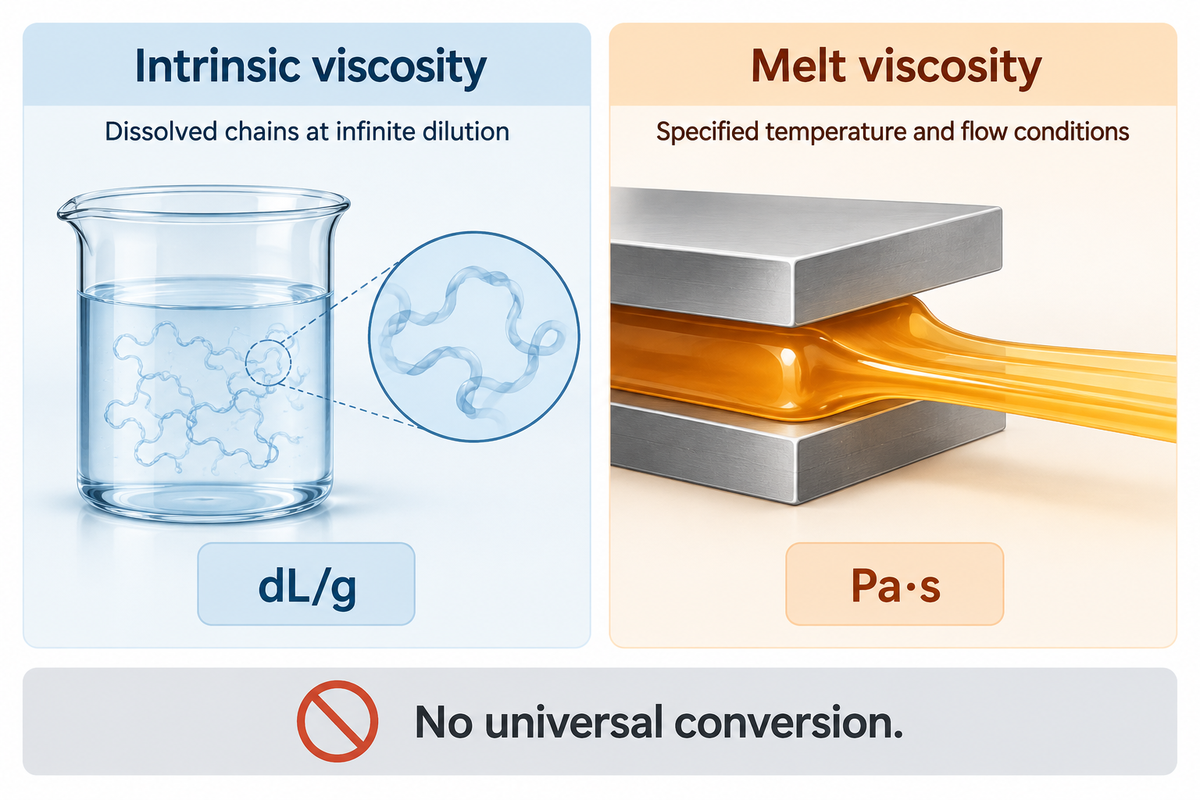
Intrinsic viscosity characterizes dissolved chains at infinite dilution; melt viscosity characterizes a molten material at specified temperature and flow conditions. Adhesive-film wetting, flow during lamination and bond development also involve the substrate and processing conditions. A calibrated relationship can connect intrinsic and melt viscosity within a defined formulation, but they remain different quantities.
The distinction is particularly relevant in the case of PES hot melt adhesive film because it’s a thermoplastic copolyester. Solution characterization can help describe its polymer chains, while molten-flow measurements address a different processing question. In this case PES refers to copolyester and not to the polyethersulfone (PES) used elsewhere in the literature.
ASTM D3236-15(2021) addresses apparent viscosity of hot melt adhesives and coatings. Its stated scope covers values up to 200,000 mPa·s at temperatures up to 175°C. The method discusses the effect of low shear and the influence of spindle and rotational speeds. Equivalent shear conditions and the rheological behavior of non-Newtonian materials are important when comparing results obtained in different laboratories.
An apparent shear viscosity value interpreted by a plant manager must account for the relevant thermal and shear history. Low-shear flow can differ from high-shear flow. A correlation developed for one composition should stay with that composition and test regime, rather than becoming a universal conversion from dL/g to Pa·s.
Thermal deformation is a separate question. Dimensional response to heat and load deals with movement of specimen and not with the infinite dilution limit. The properties of polymers demand complementary measurements. Using them gives material decisions the right observation without bringing into play a single viscosity number to give account of the physical properties of the film.
A value of 0.80 dL/g and a melt reading of 800 Pa·s describe different states and dimensions. The latter equals 800,000 mPa·s, which exceeds the stated 200,000 mPa·s scope limit of D3236. The method should be applied within actual conditions and limits, rather than within the comfort zone of a test name.
Reading a method and troubleshooting a test
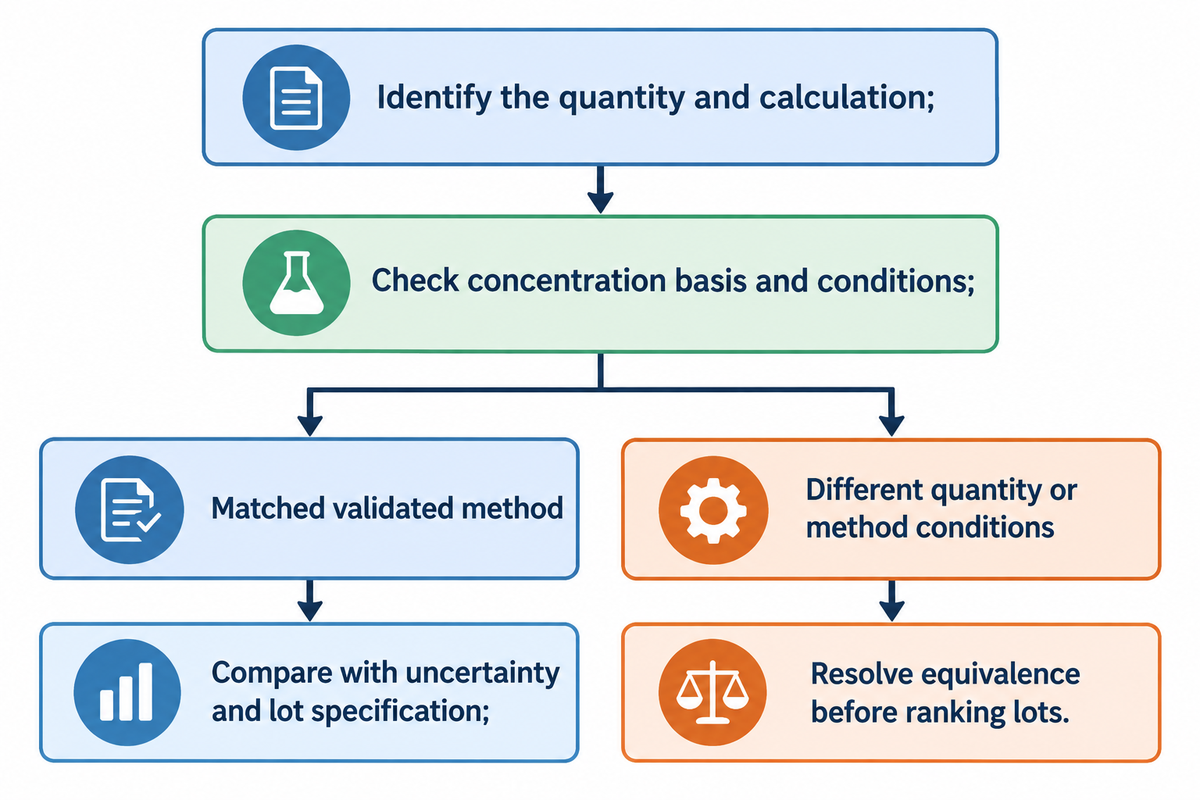
A viscosity report identifies the measured quantities and calculation before presenting the results. Polymer identity, solvent, temperature and concentration basis define the comparison. Sample preparation, blank behavior and the fitted concentration range help explain unexpected values. Complete and stable dissolution is a prerequisite to interpret a dilute solution viscosity measurement.
Two examples illustrate that a method number alone is not sufficient. ASTM D4603-26 determines inherent viscosity of soluble PET by glass capillary viscometer at its specified 0.50% concentration and solvent conditions. The NEN listing for ISO 1628-5:2015 describes viscosity number, also called reduced viscosity, for specified thermoplastic polyesters and soluble copolyesters. Neither label should be silently replaced with an extrapolated [η].
Incomplete solubility or insoluble constituents can give persisting particles during intrinsic viscosity determination. In a polymeric sample, colorants, inorganic fillers and other additives complicate what the concentration represents. Filtering a sample changes the analytical question if it removes a material fraction that matters to the specification. Preparation and reported polymer mass basis should be in agreement.
Unexpectedly negative intercepts require investigation of solvent blanks, concentration records, fit range and sample behavior. Increasing the order of the polynomial to explain the measurement can conceal the real reason. Drift in temperature or degradation during dissolution can also affect a measured series. Relying on the raw data rather than assuming a regression coefficient would be more informative.
Polymer-Lot Comparability Matrix
Example: use the following report patterns to make a judgment on whether a viscosity comparison can be made. The matrix organizes measurement questions; it doesn’t rank adhesive grades by quality.
| Report pattern | Comparison decision | Reason |
|---|---|---|
| Same grade, solvent, temperature, quantity and validated method | Proceed with the method’s uncertainty and lot specification | A common measurement basis exists |
| Same dL/g value, different solvents | Use matched-method testing or a validated bridge | Conformation can change |
| 25°C report versus 30°C report | Resolve method equivalence before ranking lots | Temperature is part of the system |
| Inherent value versus extrapolated intrinsic value | Keep the results in separate fields | Finite value and limit differ |
| Viscosity number versus inherent viscosity | Identify the underlying ordinate | ηsp/c differs from ln(ηᵣ)/c |
| Single-point estimate versus concentration-series fit | Use method-specific validation | The approximation has assumptions |
| Same composition, changed architecture | Evaluate the structural change separately | Sequence and branching affect chain response |
| Filled film versus neat-resin mass basis | Resolve polymer concentration and preparation | Total sample mass can misstate polymer mass |
| Melt Pa·s value versus solution dL/g value | Select the quantity relevant to the decision | Different states, units and shear conditions |
For routine interpretation of material test reports, retain the raw results and their conditions together. Conditioning can be important; moisture uptake and conditioning demonstrate the importance of sample history in a traceable material record.
A PET report at 0.50% under D4603-26 indicates inherent viscosity, while a hypothetical 0.40 g/dL calculation can produce both reduced and inherent ordinates from the same ratio. Concentration notation and the reported quantity require explicit fields. Resolving the distinction requires looking beyond dL/g units.
Industry outlook: choosing a measurement route and requesting comparable results
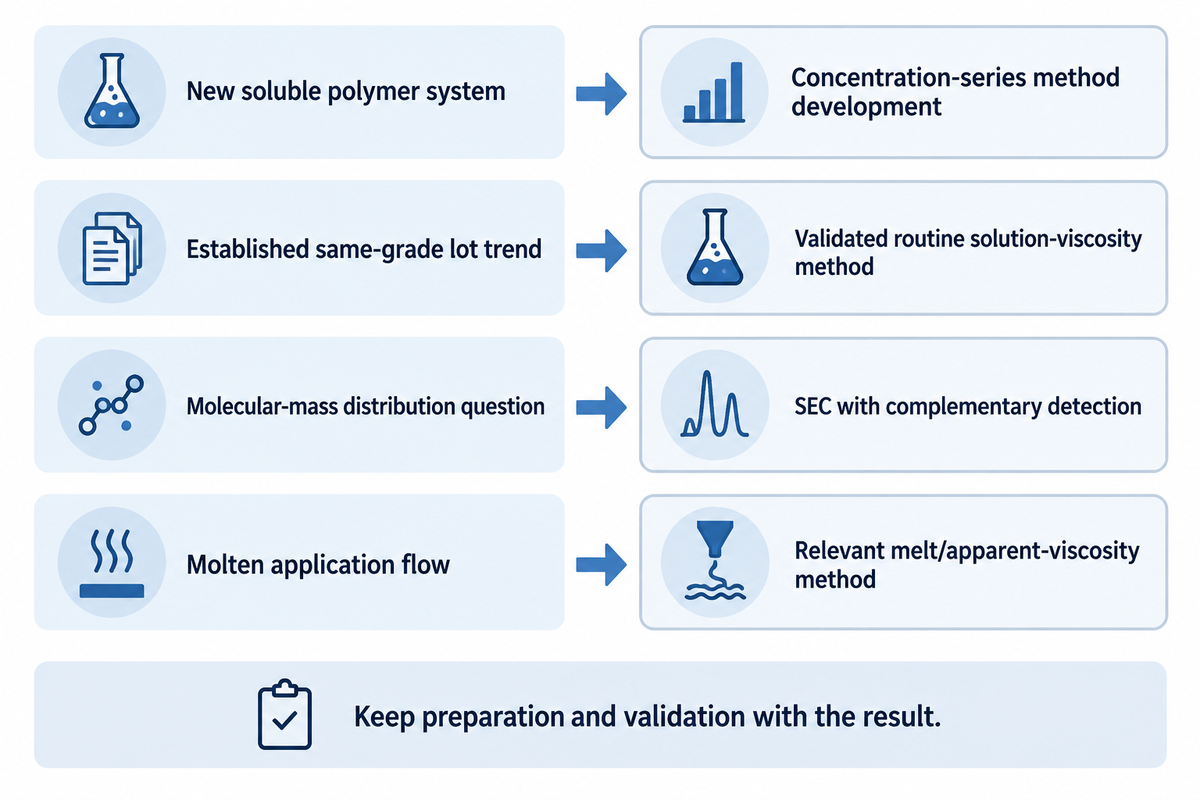
The May 2026 listing update for ASTM D4603-26 provides a reported quantity and a method edition that can be used as a purchasing guide. Laboratories can automate viscosity analysis, but automation does not change the definition of intrinsic viscosity. Choose a route for the actual polymer and decision, then keep sample preparation and calculation details attached to its result.
Many lab workflows can reduce the number of manual actions required for repeat measurements. Dissolution can be time-consuming, especially when a crystalline polymer or a complicated sample requires extensive preparation. An automated viscometer, therefore, is one part of a measurement route, rather than a substitution for establishing solubility and a suitable analytical method.
Single-point methods also deserve a fair comparison. Pamies and colleagues’ 2008 comparison of single-point and dilution procedures found condition-dependent bias in theoretical analysis and simulation. A corrected single-point procedure can perform well under suitable conditions. More concentrations don’t automatically make every extrapolation more accurate.
Example: A quality team wants to compare a copolyester film. Quote A gives the polymer, solvent, temperature, concentration series and reported [η]. Quote B offers a faster single-point result but calls it only “viscosity.” Quote A gives a better basis for comparison at this stage; Quote B is comparable if it identifies the quantity calculated and validated for the sample system. If the actual question concerns the flow of molten coating, both quotes answer only part of the question. Therefore, the purchasing request should have included an appropriate melt rheometry measurement rather than more replicas of the same solution which can’t answer the question concerning the processing.
| Decision or sample class | Useful route | Required information |
|---|---|---|
| New soluble polymer system | Method development with concentration series | Dissolution, conditions, curvature and uncertainty |
| Established same-grade lot trend | Validated routine solution-viscosity method | Fixed quantity and acceptance basis |
| Limited sample for one concentration | Suitable single-point estimation | Formula and system-specific validation |
| Many routine soluble samples | Automated capillary or differential viscometry | Preparation capacity and method equivalence |
| Soluble PET under D4603 conditions | Specified inherent-viscosity procedure | Edition, finite concentration and solvent |
| Copolyester under ISO 1628-5 scope | Applicable viscosity-number procedure | Specified solvent and solubility conditions |
| Molecular-mass distribution question | Suitable SEC with complementary detection | Calibration, detectors and separation assumptions |
| Molten application flow | Relevant melt/apparent-viscosity method | Temperature and equivalent shear conditions |
| Thermal deformation of a film | Appropriate dimensional thermal testing | Load, geometry and thermal program |
A laboratory request that keeps the decision clear
Request full polymer and grade identity; intended quantity; standard and edition; solvent; temperature; concentration units and preparation; extrapolation or estimation method; uncertainty; sample-conditioning history; and confirmation of complete stable dissolution of a new material prior to adoption of a routine correlation. In case of a processing comparison, specify the relevant melt temperature and shear conditions.
Use the two matrices to prepare a focused request and return to the polymer characterization knowledge hub for additional behavior. A clear laboratory brief connects the result to the decision without treating intrinsic viscosity as a universal grade, melt-flow rating or adhesion specification.
Frequently asked questions
Does intrinsic viscosity have units?
Yes. Intrinsic viscosity is measured in volume-per-mass units, e.g. dL/g, or cm³/g.
The concentration basis determines the numerical units of reduced and inherent viscosity before extrapolation. If c is in g/dL, dividing a dimensionless ordinate by c gives dL/g. A value of 0.80 dL/g equals 80 cm³/g. Neither is a dynamic-viscosity unit such as Pa·s, so the unit should stay beside the number whenever results are transferred between reports or calculation sheets.
What is intrinsic viscosity of PET?
PET intrinsic viscosity runs by grade: one polymer reference table lists 0.7–0.85 dL/g for bottles, 0.40–0.70 for textile fiber, 0.6–0.7 for biaxially oriented film and 0.72–0.98 for technical fiber.
Polymerization history, degradation and the distribution of chain lengths affect the result within a specified measurement system. A laboratory report should name the PET grade and conditions, then distinguish an extrapolated or estimated intrinsic value from inherent viscosity measured under ASTM D4603-26. A numerical target belongs to an agreed material specification and test method; it should not be copied from an unrelated fiber, bottle or copolyester application.
Can intrinsic viscosity be used as a QC parameter for the structure and size of polymers and other macromolecules?
Yes, it can serve as a quality control parameter, i.e. within a controlled and validated material system.
Holding the polymer, solvent, temperature and method fixed allows changes in solution-chain response to be tracked between lots. The interpretation remains narrower than a complete molecular structure determination. Branching, architecture and additives can affect the reading, while different molecular-mass distributions may share a similar bulk value. Complementary chemical or chromatographic characterization is appropriate when the decision requires those additional distinctions.
Can specific viscosity be negative?
Yes mathematically: ηsp is negative when the measured relative viscosity is below one. For a polymer test expected to increase viscosity, that observation calls for scrutiny of the solvent blank, temperature, sample and calculation rather than automatic acceptance of the derived intercept.
Will intrinsic viscosity change?
Yes. Changes in architecture and measurement conditions, chain scission and chain extension can impact it. The cause matters: A polymer degradation event and a solvent temperature change are of a different nature.
A practical investigation separates changes to the material from changes to the test. Begin with the method edition, solvent, measurement temperature and sample preparation. Compare concentration calculations and the raw solution-to-solvent observations. Once those match, consider whether processing changed the chemical composition or molecular chains, and whether moisture or thermal history affected the sample before analysis. A lower number alone doesn’t identify a reaction pathway. The pattern across controlled measurements and complementary characterization gives the interpretation its footing.
Why is intrinsic viscosity important?
It offers a practical way to characterize dissolved polymer-chain response and follow a controlled material trend. The measurement can support molecular-mass estimation with an appropriate calibration and help compare lots under matched conditions. Its value comes from a well-defined method and a relevant decision, rather than from maximizing the number.
References & Sources
- Intrinsic viscosity International Union of Pure and Applied Chemistry, Gold Book, 2025.
- The intrinsic viscosity of biological macromolecules. Progress in measurement, interpretation and application to structure in dilute solution Stephen E. Harding, 1997.
- Size Exclusion Chromatography (SEC) Tulane University School of Science and Engineering.
- Inherent viscosity International Union of Pure and Applied Chemistry, Gold Book, 2025.
- Kraemer equation International Union of Pure and Applied Chemistry, Gold Book, 2025.
- ASTM D2857-22: Dilute Solution Viscosity of Polymers ASTM International, public scope and significance.
- Macromolecular Architectures National Institute of Standards and Technology.
- Mark-Houwink equation International Union of Pure and Applied Chemistry, Gold Book, 2025.
- Relationship of intrinsic viscosity of polymer solutions to molecular weight Frank L. McCrackin, 1987, public abstract.
- ASTM D3236-15(2021): Apparent Viscosity of Hot Melt Adhesives and Coating Materials ASTM International, public scope and significance.
- ASTM D4603-26: Determining Inherent Viscosity of Poly(Ethylene Terephthalate) (PET) by Glass Capillary Viscometer ASTM International, public scope, updated May 2026.
- NEN-EN-ISO 1628-5:2015: Thermoplastic polyester homopolymers and copolymers Netherlands Standardization Institute, public scope.
- Determination of intrinsic viscosities of macromolecules and nanoparticles. Comparison of single-point and dilution procedures Pamies and colleagues, 2008, public abstract.
ABOUT TENGYANG
Industrial hot melt adhesive materials for bonding routes
Shanghai Tengyang New Materials Technology Co., Ltd. supports material discussions for production teams working with bonded products.
Available forms: hot melt adhesive film, web, powder and granules. Material families: TPU, EVA, PA, PES and PO.
CONTACT PROFILE
Betty Fang
Contact for material inquiries.