Get in touch with Tengyang Company

Fatigue testing examines how a material or assembly responds to multiple load cycles. For polymers, a cycle count is useful only if the report identifies load range, specimen, temperature and failure criterion. A result from a rigid test bar can’t automatically qualify a flexible film or a bonded laminate.
Updated October 2026
Compare fatigue reports by their test conditions and observed outcomes. Record maximum and minimum load, control mode, frequency, specimen temperature, geometry and endpoint. A specimen surviving a planned stop is a runout; that observation doesn’t establish a service-life guarantee.
The report states “one million cycles passed”. This leaves many decisions undecided. Was the test stopped at its planned limit? Was a crack monitored continuously or at intervals? Did the specimen heat up or stretch beyond the machine’s travel? Once these details are decided, then comparisons can be made using the data. The following eight checks are questions that a laboratory can answer.
What Fatigue Testing Measures in Polymers
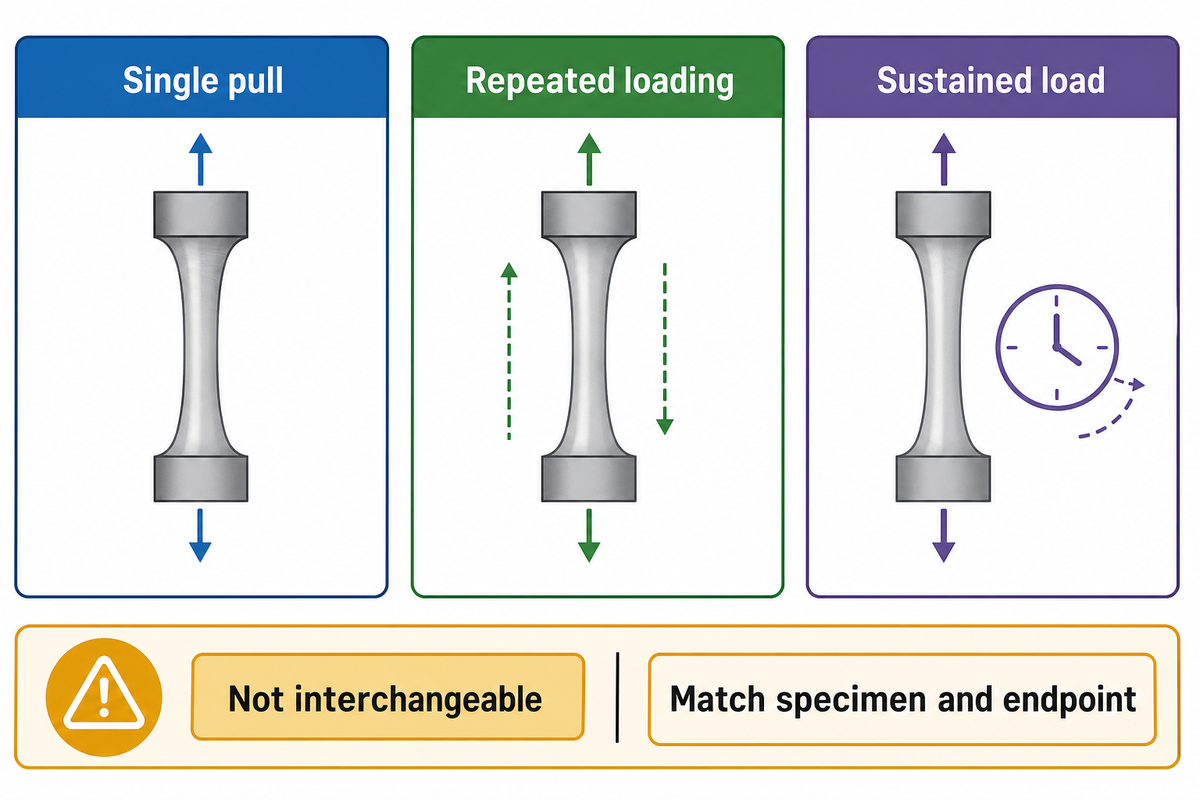
While the results of a single pull test may not show damage, repeated loading may lead to gradual damage. Polymer fatigue testing relates a defined load history to a specified endpoint. The results describe the tested specimen and conditions; to transfer it to other geometry or duty cycles requires supporting evidence.
What is a fatigue test?
A fatigue test loads and records the responses of a specimen and the number of cycles associated with a predetermined end point. Tensile, compression, or bending loads may be applied. Unlike monotonic strength testing, the focus is on the cumulative effects of fatigue. A valid test also determines the surviving specimens as well as those that terminated for reasons other than material failure.
Mechanical testing produces different types of material properties for different types of questions. Tensile strength describes resistance for a specified pull; fatigue strength is for a stated life or cycle count and test conditions. Creep testing describes deformation under sustained load. Thermal fatigue describes repeated changes in temperature. Using these terms on one datasheet doesn’t make the measurements interchangeable. Our article on How to read a materials test report shows how to correlate a stated property with the method that determined it.
High cycle fatigue and low cycle fatigue outline different approaches to testing, but steel’s fixed cycle boundary can obscure polymer behaviors. Evaluate whether elastic strain dominated the response, if permanent deformation had already occurred, and which end point of the test defined the failure of the polymer. High-cycle fatigue tests can include changes in the stiffness of the polymer as well as cyclic creep. The label doesn’t define the mechanism.
The public scope of ASTM D7791-22 limits its uniaxial method to rigid and semi-rigid plastics under relatively elastic conditions below the proportional limit. That restriction becomes relevant when the same method is proposed for highly extensible films. A laboratory should explain the reason for applying a method for a specimen instead of for treating an ASTM number as a universal approval.
A common mistake when making purchases is assuming that if a value in tensile is high, the material is durable under repeated bending. If a provider shows an effect in MPa but has no cyclic loading history, what’s missing is a fatigue test under the proper conditions. Requesting a new duplicate of the same tensile certificate won’t fill that gap.
Set the Load Range Before Comparing Cycle Counts
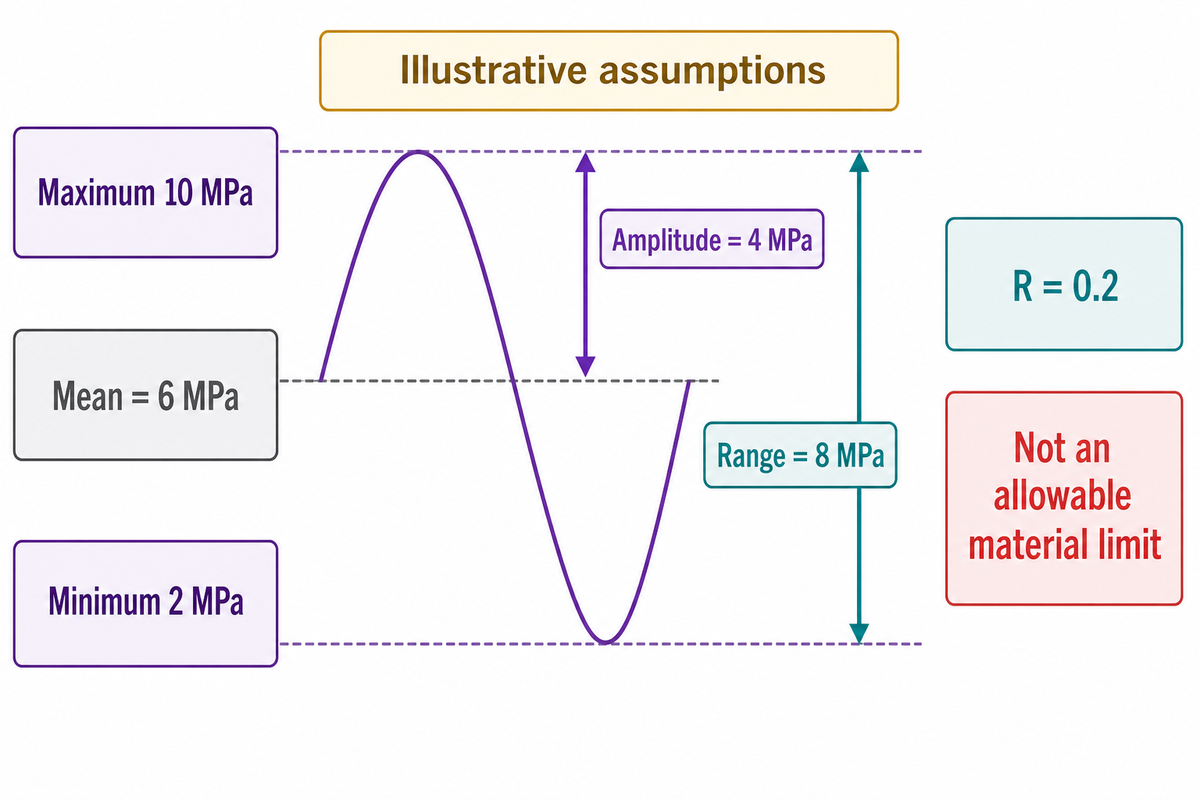
More than the size of a repeated load, maximum and minimum stress define mean stress, stress amplitude and stress ratio; the stress waveform tells us how load changes over time. Comparisons, however, need to take into account the control variable and the cross-sectional area used to determine stress, particularly when dealing with polymers which can exhibit considerable stretch.
How are fatigue testing conditions determined?
Begin with the loading condition, environment and failure cases of interest to the application. Select a method, and then agree upon the specimen geometry, level of loading, waveform, frequency, control mode and stopping rules. The testing laboratory must provide justification for any acceleration. The stress ratio is a useful consideration, but it won’t overcome differences in temperature, specimen preparation and failure definition.
To find stress ratio R, minimum stress is divided by maximum stress. Mean stress is found by adding the two and dividing by two. Stress amplitude is found by subtracting minimum stress from maximum stress and dividing by two. Nominal stress σ uses the applied force divided by a stated reference area. An alternative method for measurement uses the instantaneous area. It’s recommended reports state the convention they use, instead of leaving it to the reader to infer it.
Load Signature Record
The Load Signature Record captures the conditions necessary to interpret one cyclic test and identifies information gaps to be used when comparing suppliers.
This is an example filled in for learning how to do the calculation. It doesn’t show a recommended polymer specification, a validated protocol or Teng Yang test results.
| Field | Example record | Why record it? | Limitations / Not suitable for |
|---|---|---|---|
| Control mode | Load control, sinusoidal tension | Identifies the commanded variable | Does not hold specimen strain constant |
| Stress definition | Nominal stress; original reference area | Makes the force-to-stress calculation reproducible | Not instantaneous true stress during large deformation |
| Maximum stress | 10 MPa, assumed | States the upper turning point | Not an allowable material limit |
| Minimum stress | 2 MPa, assumed | States the lower turning point | Not a fully reversed load |
| Stress ratio | R = 2/10 = 0.2 | Shows the minimum-to-maximum relationship | Equal R does not mean equal stress amplitude |
| Mean stress | (10 + 2)/2 = 6 MPa | Identifies the tensile offset | Must not be substituted for amplitude |
| Stress amplitude | (10 − 2)/2 = 4 MPa | States half the stress range | The full range is 8 MPa, not 4 MPa |
| Frequency | 5 Hz, assumed for arithmetic | Connects cycle count with uninterrupted runtime | Requires thermal and mechanical justification |
| Temperature | 23 °C chamber setpoint, assumed; specimen trace requested | Separates chamber setting from specimen response | Does not prove the specimen remained at 23 °C |
| Specimen identity | Grade, batch, direction and dimensions attached | Defines the tested material population | A family name alone is insufficient |
| Endpoint and inspections | Defined fracture endpoint; continuous detection | Explains what the recorded cycle means | Intermittent inspection needs an interval record |
| Planned stop | 1,000,000 cycles, assumed | Identifies a possible runout | No service-life or warranty inference |
Consider a buyer comparing two hypothetical reports. Report A uses 10 MPa maximum and 2 MPa minimum; Report B uses 5 MPa maximum and 1 MPa minimum. Both have R = 0.2. Yet Report B has a mean of 3 MPa and amplitude of 2 MPa, half the corresponding values in A. Ranking the materials by cycle count would mix different stress conditions. The buyer should request matched conditions or a justified analysis of the difference. Even matched settings leave preparation, temperature and endpoint to check.
Large deformation adds another boundary. Wang and colleagues’ 2023 TPU plate study explicitly calculated nominal stress from reference area and discussed cyclic creep exceeding the fatigue testing machine’s displacement tolerance. Its specimen-specific results aren’t values for Teng Yang film. They demonstrate why the area convention and travel-limit stop reason belong in a usable report.
Match the Test Method to the Specimen
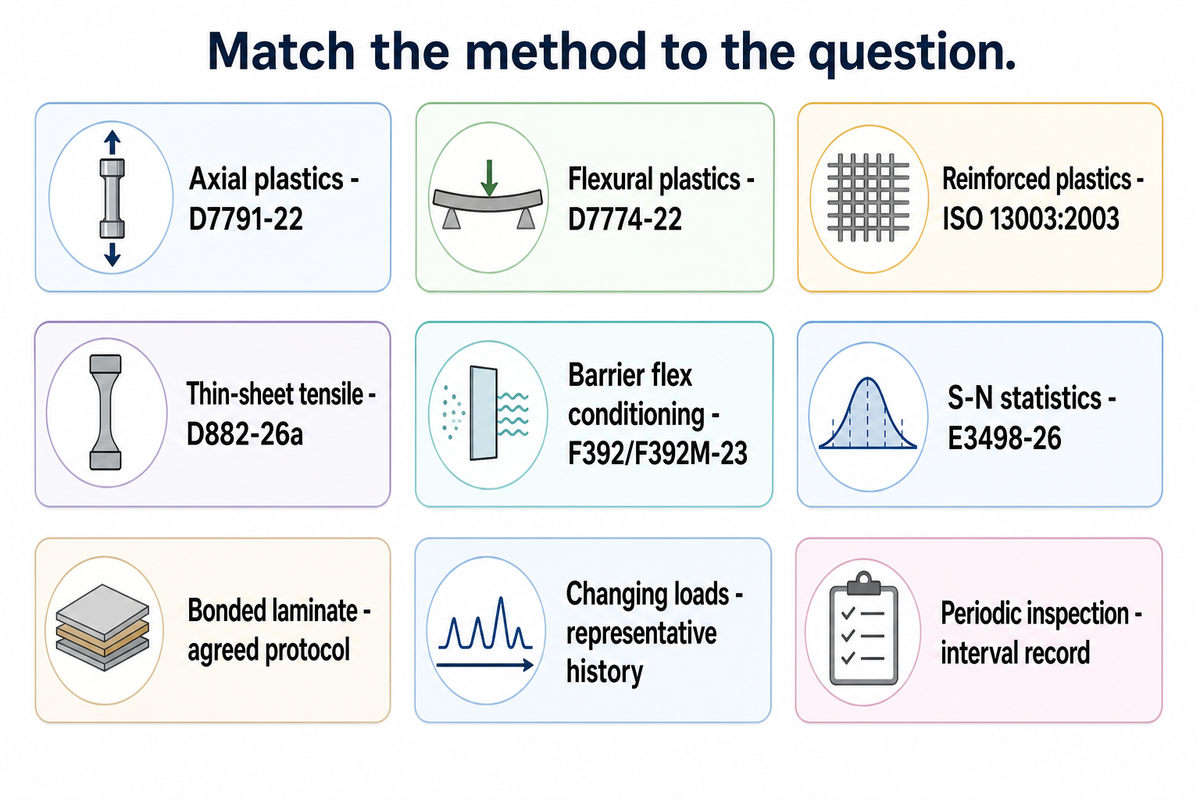
A test method is applicable only within the limits of the material, geometry and loading condition. Different decisions apply to polymer bars, flexible barrier films and fiber-reinforced laminates. Distinguish physical tests from subsequent statistical analysis, and a conditioning practice from the measurement of property performed after that conditioning.
What is the ASTM standard for fatigue testing?
No single ASTM standard covers all polymer fatigue applications. D7791-22 covers uniaxial fatigue of rigid and semi-rigid plastics, and D7774-22 covers flexural fatigue of similar material scope. Thin-sheet tensile testing, barrier-film flex conditioning and statistical analysis have separate documents. Pick the method for the specimen and engineering question, and check which edition is currently valid and what exclusions are made.
ASTM D7774-22 covers three-point and four-point bending approaches under relatively elastic conditions. ISO 13003:2003, confirmed in 2024, concerns fibre-reinforced plastics at constant amplitude and constant frequency. A confirmation date is not a new edition. D7774 also cautions that its technical content differs from ISO 13003, so their results are not directly interchangeable.
| Question or specimen | Relevant method or record | Result to request | Limitations / Not suitable for |
|---|---|---|---|
| Rigid or semi-rigid plastic in axial cycling | D7791-22 public scope | Loading history, endpoint and individual cycles | Not blanket qualification of highly extensible film |
| Rigid or semi-rigid plastic in flexure | D7774-22 | Fixture span, loading arrangement and response | Not interchangeable with axial data |
| Fibre-reinforced plastic fatigue | ISO 13003:2003 | Lay-up, direction and constant-amplitude conditions | Not a generic neat-polymer-film procedure |
| Plastic sheeting less than 1.0 mm thick | D882-26a tensile method | Tensile properties under the stated test conditions | Not cyclic lifetime |
| Flexible barrier flex durability | F392/F392M-23 conditioning | Conditioning level and agreed later property test | Subsequent tests and flex-related abrasion are outside its scope |
| S-N data with surviving specimens | E3498-26 statistical guide | Model, censoring treatment and diagnostics | Not specimen preparation or sample-size selection |
| Repeated deformation of a bonded laminate | Agreed assembly-specific protocol | Layer, interface and functional endpoint | A material coupon alone does not qualify the bond |
| Changing loads in service | Documented representative load history | Sequence, dwell and justification of simplifications | Not covered by a constant-amplitude result alone |
| Failure detected during periodic inspection | Interval record plus suitable analysis | Last passing and first failing cycle counts | Not an exact observed failure cycle |
ASTM’s active D882-26a public page covers tensile properties of plastic sheets less than 1.0 mm thick, including specified inseparable multilayer structures. A tensile test will not necessarily give a cyclic answer if the specimen is a film. Explain the cyclic question to be tested.
Similarly, discipline is required for equipment descriptions. Rotating beam fatigue of a steel specimen, a weld fatigue test and a testing program of turbine blades may describe a laboratory’s capabilities, but not establish its eligibility to test flexible polymers. The same applies to corrosion fatigue, which is an environment-specific damage question and not a synonym for every humid polymer test. Broad material testing should name the relevant method for your sample.
In a hypothetical purchase request for a 0.20 mm film, the thickness of the film might make the thin-sheet tensile method relevant. However, the correct cyclic procedure would be determined as always by an engineering evaluation. In the request for proposal, procurement should ask the lab to state the physical deformation and failure endpoint being simulated and to provide an example of a fit-for-purpose methodology. Only then should procurement accept the lab’s method number as evidence of application fitness.
Watch Frequency, Temperature and Strain Together
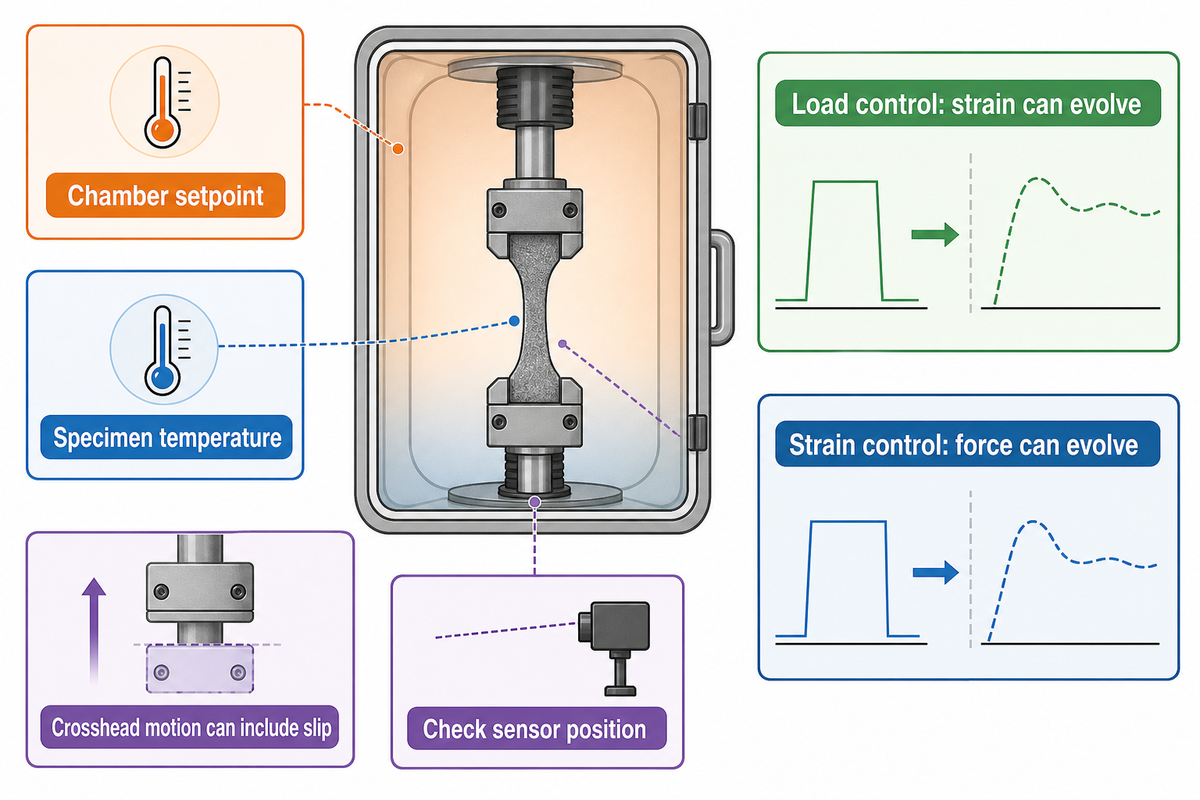
A polymer test can be affected by frequency through heat generation, time-dependent deformation and a varying strain response. A chamber setpoint can’t show if the specimen remained isothermal. Verify with temperature and mechanical data taken concurrently, and determine if the test response that’s intended to be represented was altered.
Islam and Ulven’s 2022 flax/epoxy experiment used 5, 7, 10 and 15 Hz and found increasing stabilized surface temperature at higher frequency. The authors also distinguished temperature behavior from dissipated energy per cycle. Those observations concern their unidirectional composite; they aren’t a universal frequency limit or TPU performance data.
Local temperature accuracy and spatial coverage are different requirements. A 2017 study of modified Epidian 57/Z1 epoxy found that the hottest region didn’t always coincide with the thermocouple location. Its thermal images helped reveal that mismatch. The purchasing implication is to ask where temperature was measured, not merely whether a temperature channel existed.
The viscoelastic response of polymers links deformation to time and to loading history. In load control, strain can evolve while commanded force repeats. Conversely, in strain control, the force response can evolve while commanded strain repeats. Crosshead displacement can include compliance of the machine, motion of the fixtures or slip of the grips. A gauge length strain and a record of the control variable will show what the testing system actually held constant.
Let’s say a plant manager wants to cut the run time of a hypothetical million-cycle test in half by increasing the frequency from 5 Hz to 10 Hz. Ideal cycling time falls from 55.56 hours to 27.78 hours. Again, these are real numbers but equivalent fatigue behavior remains to be seen. Quality assurance should ask for a pilot study to compare specimen temperatures and deformation at the two frequencies before approving the change in schedule. If the manager doesn’t justify the change in accelerated testing, then equivalency remains unproven despite faster motion and time savings.
Thermal equilibrium is affected by the geometry and by the heat transport through plastics. Glass transition temperature and temperature sensitivity may influence the deformation behavior, while high temperature may alter the processes of failure. Compare the measured temperature to the applicable range of the material. Don’t base the safe operating range of the material on the chamber display.
A servo-hydraulic system, actuator and a universal testing machine can all differ in their capabilities. The lab must ensure suitable force resolution, waveform tracking, alignment and travel for the desired cyclic load. A large hydraulic frame rating in kN tells little about the accuracy of a small load on a thin specimen. Instead, evaluate equipment by the operating range used during testing and provide that information.
For a 5 Hz test program, specimen temperature and strain measurements should be recorded during the test and not just at test program start. Changes in modulus, permanent extension or machine behavior (i.e. actuator travel limits, etc.) can lead to different interpretations of the test results. Ask the laboratory for an explanation of the changes before using test results to compare or rank different materials.
Read S-N Curves and Runouts Correctly
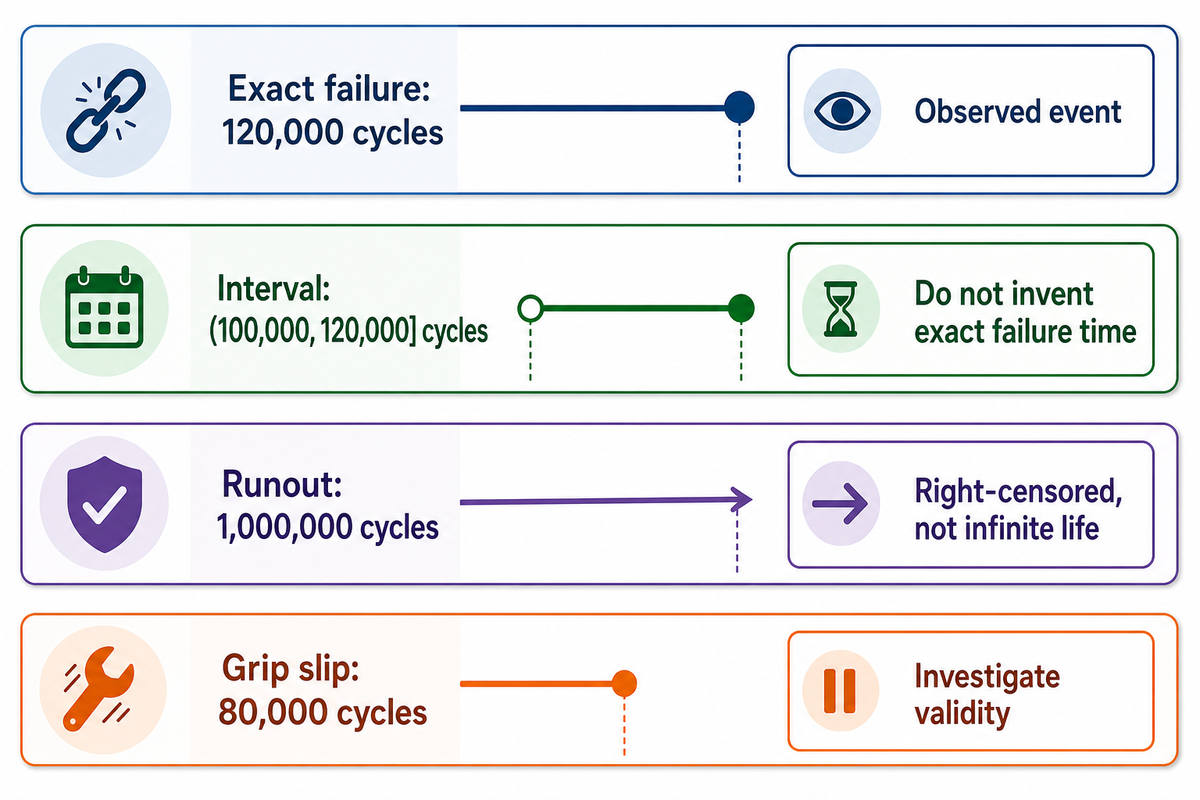
An S-N plot relates a stated stress measure to cycles associated with a defined endpoint. In the case of failed specimens, one needs to identify the precise reason for termination, the nature of the failure mode, how precisely failure was observed and whether the specimens came from a comparable population. In the case of planned survivors, one needs to identify the limits at which termination was to be expected and whether failure was observed. Acceptance of a fitted line should be based on all the above considerations.
What is an S-N curve or an S-N diagram?
An S-N curve, also known as an S-N diagram, plots a specified stress measure against the number of cycles to failure under defined conditions. Each point requires the same interpretation of stress and failure. Surviving specimens stopped at a planned limit need to be identified. A relationship expressed as a line describes the tested population and the limits of the population with uncertainty; it isn’t a universal life conversion.
Ask what S means (maximum stress, stress amplitude, or something else)? A fitted coefficient means something only with the equation, units and population used to develop it. Keep the test data (definition) with that equation to provide a means to verify the fitness of the line. Scatter is fatigue data, and so the plotted line as well as individual observations and the stated statistical treatment are of importance. Combining different load ratios, environments, or failure modes only to get more points must not be done.
3-Outcome Runout Ledger
The 3 Outcome Runout Ledger separates failed, planned surviving, and interrupted tests, with a second field for the precision of the observed endpoint.
The examples of cycle counts that follow are purely illustrative.
| Outcome | Example observation | Record | Permitted interpretation and next action |
|---|---|---|---|
| Failure, exact detection | Defined fracture detected at 120,000 cycles | 120,000 cycles; endpoint and detection method | Observed event under these conditions; retain the raw record |
| Failure, interval detection | Passed inspection at 100,000 cycles; failed at 120,000 | Failure interval (100,000, 120,000] cycles | Use an analysis suitable for interval information; do not invent an exact event time |
| Planned surviving stop | No defined failure at 1,000,000 cycles | Runout at 1,000,000 cycles | Right-censored observation for that endpoint; not infinite life |
| Interrupted or invalid test | Grip slip detected at 80,000 cycles | Reason, traces and last defensible observation | Investigate validity; do not automatically treat it as material failure or an ordinary runout |
The NIST statistical handbook’s censoring explanation distinguishes failures that occur at known times, survival observations and failure intervals. That distinction is relevant when inspections are performed at scheduled times. For intervals in the range of 100,000 to 120,000 cycles, the first failed inspection sets an upper bound, and doesn’t indicate which cycle crossed the endpoint.
The consideration of right-censored runouts is a part of the maximum-likelihood analysis of S-N data in ASTM E3498-26. Variable mean stress or strain, variable-amplitude cycling, experimental techniques, sample-size selection and test-level selection are not included. It also advises that going beyond the collected ranges may be non-conservative. Fitting data cannot repair an invalid test or supply missing service conditions.
One million cycles at 5 Hz would require 1,000,000 / 5 = 200,000 seconds or 55.56 hours of continuous cycling. Conditioning and inspection times as well as pauses add time. Multiple specimens may require multiple runs. The estimation is made for test duration. It provides no insight on the years of service that a product may provide in real-world conditions.
A fatigue limit requires careful expression. Pastukhov and co-workers’ 2020 PEEK research reports on an apparent endurance limit for plasticity-controlled failure with evolving yield stress. The authors address failure with long-term crack growth. Neither of the statements “All polymers have an endurance limit” or “No polymers show an endurance limit” is truly representative. State the material, mechanism and observation range.
Separate Material Fatigue from Bonded-Assembly Failure
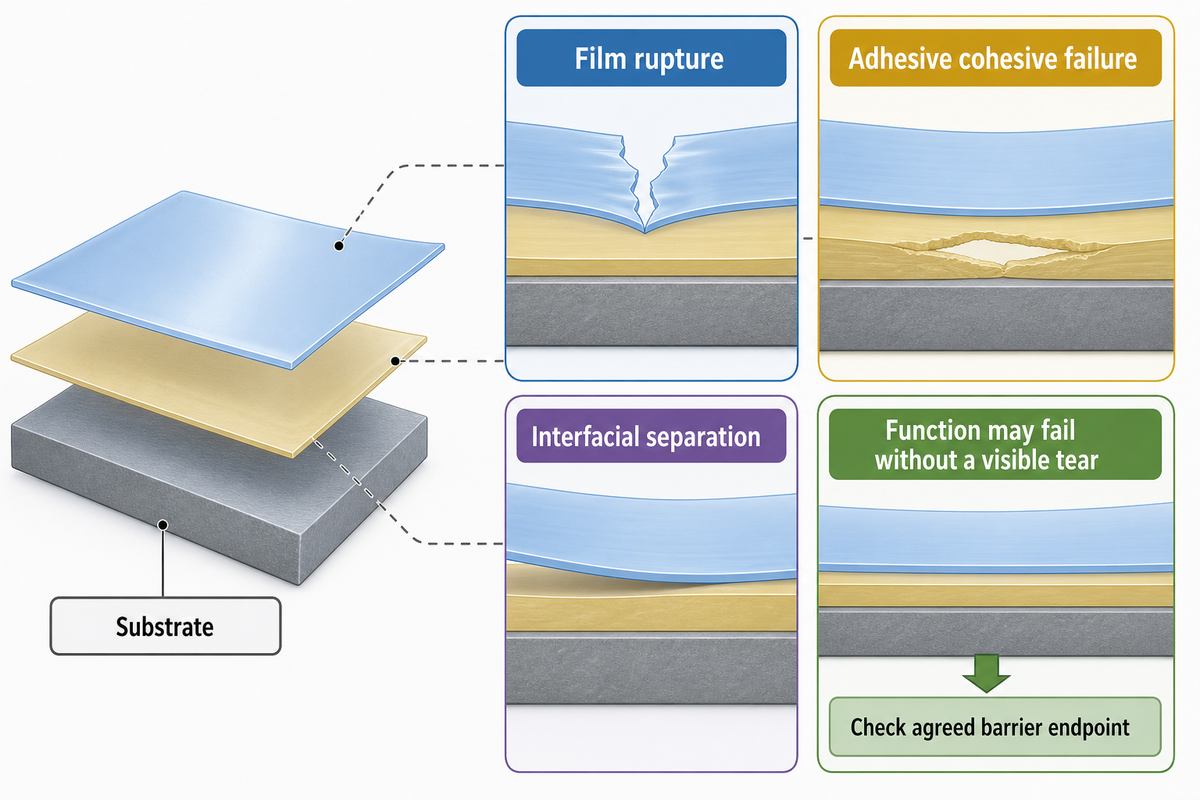
A film, adhesive, interface or substrate in a bonded assembly can all fail for different reasons. Material fatigue data describes failure within one part of the assembly. The failure of the other parts of the assembly also needs to be taken into account including the construction, deformation path and functional requirements the finished product must meet.
Flexible laminates can include TPU film which is a thermoplastic polyurethane and can be repeatedly deformed with adjacent layers. Connecting fatigue testing to that material includes looking at the grade, thickness and function in the assembly. The product category doesn’t assign a cyclic-life rating; evidence for the specified film and bonded construction should be provided to make that claim.
Find out where failure has occurred. A film rupture, adhesive cohesive failure and interfacial separation and failure initiated by clamp occur by different mechanisms. An increase in crack length may occur prior to complete failure, however, before reporting crack growth rate, an appropriate measurement and analysis is required. A crack growth rate usually comes from crack-length measurements against recorded cycles; a fatigue fracture photograph alone doesn’t supply it. Should shear at a bonded interface be the service concern, agree to a loading condition that represents that concern.
Fazlali and colleagues’ 2024 carbon/epoxy study showed that the end-tab arrangements that performed the best in fatigue tests differed from the arrangements that performed best in quasi-static tests. Those results compare end-tab setups for carbon/epoxy specimens; they don’t identify the best clamp design for TPU. The take-home point is to examine preparation, stress concentration and misalignment, before drawing a rash conclusion about the material.
Function can disappear without a visible tear. ASTM F392/F392M-23 deals with flex conditioning of flexible barrier materials. The public text focuses on flex-induced pinholes and the assessment of gas or moisture transmission, and excludes flex-related abrasion from the practice. Therefore, for a barrier application, an agreed permeability or pinhole limit, as well as a visual assessment, may be required.
In the case of a hypothetical laminate that still looks intact after its planned cycling, if the stipulated requirement is barrier performance, then we can’t assume acceptance by visual survival. Quality assurance hinges on the specified post-conditioning measurement and its acceptance criteria. Procurement should review if the measurement was provided in the quotation. A less expensive test that reports only complete specimen failure, may omit the function the buyer needs to retain. Agreement to this point, prior to testing, prevents the commissioning of a second test program to answer the same question.
The Erich Schmid Institute’s FLEX-E-TEST example used silver features on a PEN substrate and showed different damage under different bending directions with a fixed 5 mm radius. It’s evidence of flexible electronics, not of TPU. Thus, radius should be compared alongside bending direction, and the mechanism of failure should be reviewed as well.
Peel testing of flexible laminates and interpreting adhesive test results should be used to answer the relevant bond-separation question, with the failure location kept intact when interpreting the results. One peel value can’t substitute for the defined cyclic assembly test. Each measurement should contribute to the same question pertaining to the application.
Build a Test Request That Produces a Usable Report
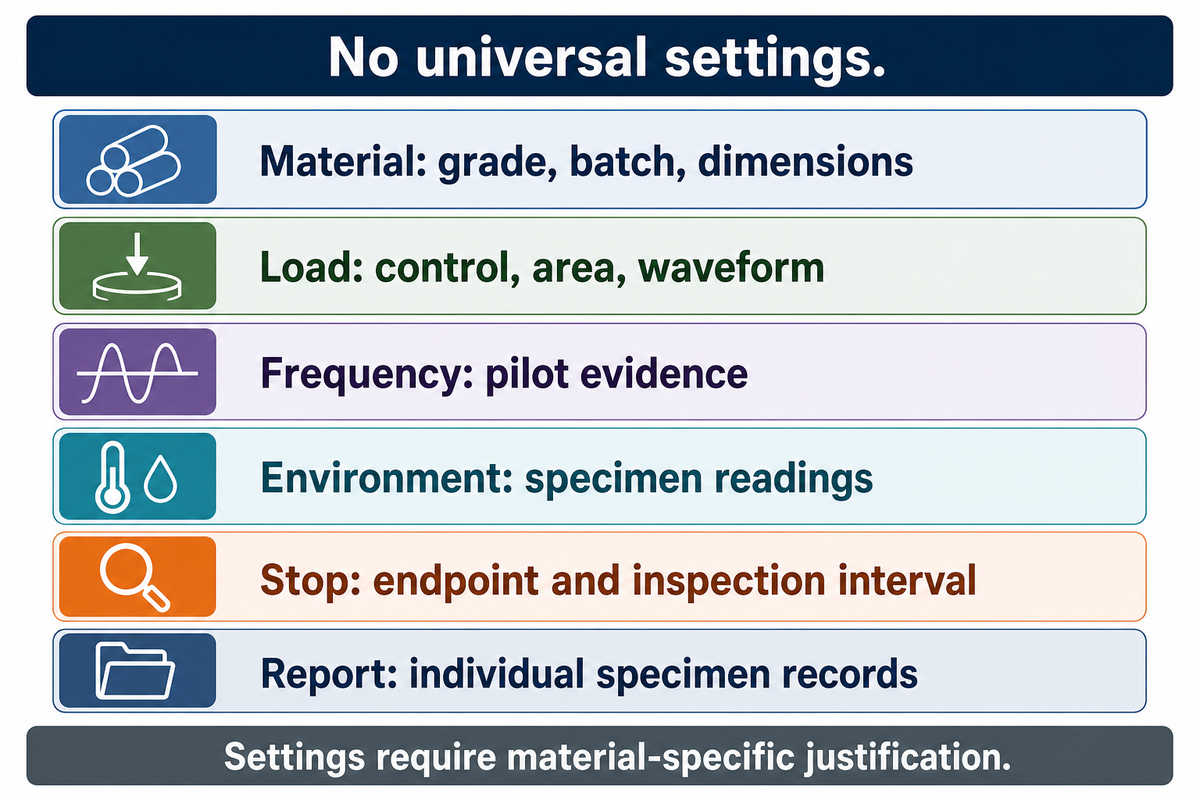
A useful test request tells the laboratory what decision the results must support, and gives instructions for the report to be written in the format required to support that decision. Agreement on method suitability, specimen preparation, control settings, endpoint detection and interruption should be reached prior to testing. Procurement can then compare quotations covering the same work, rather than comparing a headline cycle count.
The following record structure should be submitted to testing services. The example numbers are to discuss specific examples with the laboratory and aren’t universal threshold values. The laboratory and the responsible engineer should verify the settings against the material and application requirements.
Test request checklist: confirm every proposed setting
| Parameter | Recommended range | Why it matters | How to verify |
|---|---|---|---|
| Material and geometry | No universal range; attach grade, batch and dimensions in mm | Defines the specimen population | Sample drawing and preparation record |
| Load settings | No universal range; example 10/2 MPa pending suitability review | Defines mean and amplitude | Recorded control mode, area convention and waveform |
| Frequency | ASTM’s uniaxial method for rigid and semi-rigid plastics allows 1-25 Hz and recommends 5 Hz or less; example 5 Hz subject to pilot evidence | Affects runtime and possible self-heating | Waveform and specimen-temperature traces |
| Environment | No universal range; example 23 °C setpoint plus measured specimen temperature | Separates setting from response | Conditioning history, sensor position and logged readings |
| Stopping rule | No universal count; example 1,000,000-cycle planned stop | Defines possible runouts | Written endpoint, inspection interval and stop reason |
| Report scope | Individual records for every specimen | Preserves scatter and invalid-test evidence | Data files, photographs, model assumptions and exclusions |
Quality assurance owns the validity question, “did the test measure the agreed-upon endpoint?” The plant team owns the relevant duty and environment. Procurement verifies preparation, conditioning and reporting. Finance assesses equivalent scope and scheduling assumptions. A quote for 55.56 hours of ideal cycling isn’t necessarily a quote for the entire program.
Request the number of specimens and stress levels with the laboratory’s rationale. Dan Adams’s 2020 technical column on composite fatigue describes the relationship between stress ratio, failure and planned runouts. Adams is associated with a test-fixture supplier; the column is useful method context, not independent certification of a particular laboratory. Official method scope and your decision requirement still govern the program.
When a cheaper fatigue test cannot answer the question
An inexpensive program isn’t appropriate when the endpoint omits the function being accepted, the specimen excludes a critical joint or justifying rationale isn’t provided for the accelerated conditions. Small specimens removing the feature that creates stress concentration in the finished part raise the same concern and should be discussed. A coupon is likely appropriate for screening fatigue performance, but may not be sufficient for acceptance at the assembly level.
You shouldn’t pay for an S-N fit assessment until you see the data behind it. Reasons for termination may be missing, failure modes may be mixed or recorded temperature excursions may be missing. In such cases the fitted line may be less useful than a smaller, well documented dataset. An assessment of unexpected failures begins with those records. What happens after a grip slip, a power interruption or a travel limit stop? The response should preserve the evidence and explain what’s necessary, if anything, to be done. It shouldn’t convert every incomplete test to a passed specimen.
Do
- Define the functional or mechanical endpoint.
- Retain individual traces and termination reasons.
- Compare quotations with equivalent report scope.
Don’t
- Convert a runout into a warranty.
- Assign grip damage to the polymer without investigation.
- Transfer a research specimen’s life to a commercial film.
What Current Measurement Research Changes
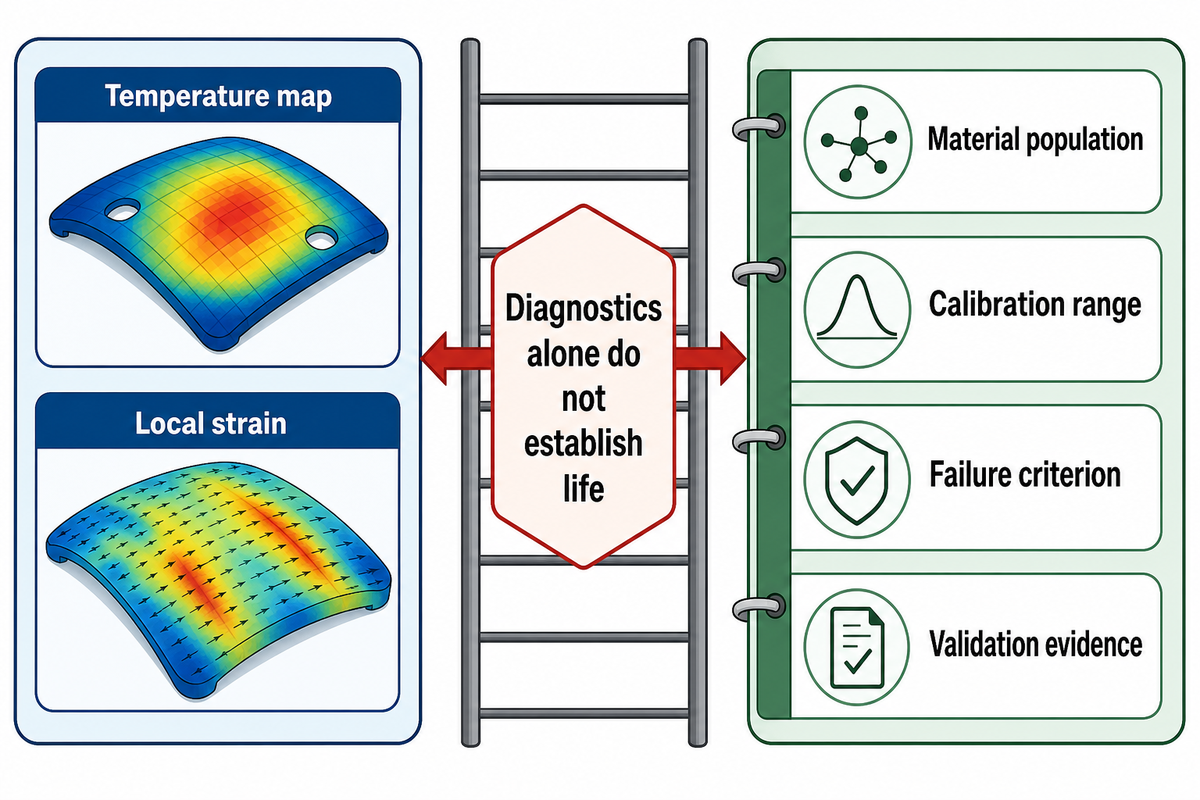
Current editions of the standards make it worthwhile to check both the physical method and the analysis requested in a laboratory quotation. Better diagnostics may explain why a given specimen changed during cycling. They wouldn’t provide support for extending a product’s proven life for the intended application, unless measurements, models and validation also supported that conclusion.
ASTM’s public page identifies E3498-26 as active with an update dated September 21, 2026. Its explicit treatment of right-censored observations supports a request to include runouts in the report and state the statistical assumptions. D882-26a is listed as active with an October 1, 2026 update. Its tensile scope is different from measurement of fatigue life.
Optical methods add another type of evidence. Bogdanov and colleagues’ 2022 polyimide study combined digital image correlation with cyclic mechanical measurements. Its findings concern the tested neat polyimide and its loading procedure. Changes in strain patterns or hysteresis can help diagnose damage, but the authors explicitly limited residual-life interpretation.
“this does not enable to unambiguously predict residual life”
When formulating a new technique, ask what type of diagnostic observation would impact an engineering decision. A temperature map may show a region of high temperature; a local strain measurement may separate specimen deformation from fixture motion. Both don’t, necessarily, provide a life-prediction model. If a laboratory suggests the use of a life-prediction model based on the above observations, request its material population, calibration range, failure criterion and validation evidence. Treat its output as a means of material selection only after validation for the material population and conditions.
Key takeaway
A 1,000,000-cycle runout records survival to a defined stop under stated conditions. Preserve the endpoint, load history and measurement limits before using that observation in an engineering decision.
Begin the next request with the load record and outcome ledger and adapt them to the specimen and service question. Keep the method and source data selected with the report. The Teng Yang test-reading library has related guides to interpreting the material and adhesive measurements that accompany a fatigue program.
Fatigue Testing FAQs
How long does fatigue testing take?
About 55.56 hours of machine time for one million cycles at five cycles per second, before setup, pauses and repeat specimens.
A continuous run of one million cycles at five cycles per second takes about 55.56 hours before setup or pauses. That arithmetic estimates machine time only. Conditioning, inspections and repeat tests can add time, while several specimens may require separate runs. The laboratory must first show that the chosen frequency doesn’t create unrepresentative heating or deformation.
Is fatigue testing destructive?
It can be destructive, and an unbroken specimen may still contain damage.
A specimen may crack, lose stiffness or fracture while cycling continues. Reaching the agreed stop count without meeting the defined failure criterion produces a runout, not proof that no damage occurred. Keep tested specimens separate from production stock, retain their identification and agree any follow-up inspection before the program begins. Functional checks may reveal damage that visual inspection misses.
What factors can affect fatigue test results?
Loading, environment, preparation and endpoint detection all affect interpretation.
Load range, mean stress, waveform, frequency, temperature, humidity, specimen geometry and preparation can all affect a polymer fatigue result. Gripping and alignment also matter. Compare reports only after checking these conditions and the stated failure endpoint. If a report omits a condition that could explain a difference, request it before ranking materials by cycle count or accepting a lifetime claim.
How are fatigue testing results reported?
Keep individual observations alongside any fitted curve.
Report each specimen’s loading conditions, endpoint, termination reason and cycle count. Separate failures, planned runouts and interruptions. Record last-pass and first-fail inspections when failure is only known within an interval.
What information is needed before starting a fatigue testing project?
Supply the specimen definition, service question and required report contents.
Give the laboratory the material grade, processing history, specimen dimensions, intended loading mode and expected environment. State the engineering question and endpoint. Agree who chooses load levels, specimen count and stop rules instead of borrowing them from an unrelated example. Procurement should request conditioning time, expected machine time, data delivery and interruption handling, because those items determine whether competing quotations cover the same testing needs.
What is plane bending fatigue testing?
It repeatedly bends a specimen in one plane.
Fixture geometry sets the stress distribution. Check method scope and deflection limits before substituting bending fatigue results for axial data, particularly when deformation changes the specimen geometry substantially.
What is thermal fatigue testing?
It examines damage associated with repeated temperature changes.
Thermal cycling differs from mechanically loading a specimen at one controlled temperature. A polymer may also heat itself during mechanical cycling, which creates another measurement issue. Specify the service question before choosing the program: repeated temperature changes, constant-temperature mechanical fatigue and self-heating investigations don’t measure the same response. Each needs suitable boundary conditions and a defined endpoint before its results can support a comparison.
About this guide
Published by Teng Yang as a public-source guide to material-test interpretation. The numerical load records, scheduling calculations and purchasing scenarios are illustrative, not customer measurements or acceptance specifications. Named studies concern their stated research specimens. No cited test result, certification or patent is attributed to Teng Yang products. Method selection and acceptance criteria require agreement for the actual material and application.
References & Sources
- ASTM International: D7791-22, Uniaxial Fatigue Properties of Plastics
- Wang et al. (2023), Cyclic Deformation and Fatigue Failure Mechanisms of Thermoplastic Polyurethane
- ASTM International: D7774-22, Flexural Fatigue Properties of Plastics
- International Organization for Standardization: ISO 13003:2003
- ASTM International: D882-26a, Tensile Properties of Thin Plastic Sheeting
- Islam and Ulven (2022), loading frequency and flax-fibre composite fatigue
- Impact of Frequency of Load Changes in Fatigue Tests on the Temperature of the Modified Polymer (2017)
- National Institute of Standards and Technology: Censoring
- ASTM International: E3498-26, Maximum Likelihood Estimation of Fatigue Life and Fatigue Strength
- Pastukhov et al. (2020), Physical Background of the Endurance Limit in PEEK
- Fazlali, Lomov and Swolfs (2024), specimen gripping and carbon/epoxy fatigue
- ASTM International: F392/F392M-23, Conditioning Flexible Barrier Materials for Flex Durability
- Austrian Academy of Sciences, Erich Schmid Institute: FLEX-E-TEST
- Dan Adams (2020), Fatigue Testing of Composites, CompositesWorld
- Bogdanov et al. (2022), Sensors 22(16), 6034