Get in touch with Tengyang Company
Glass Transition vs Melting Point: How to Tell Them Apart

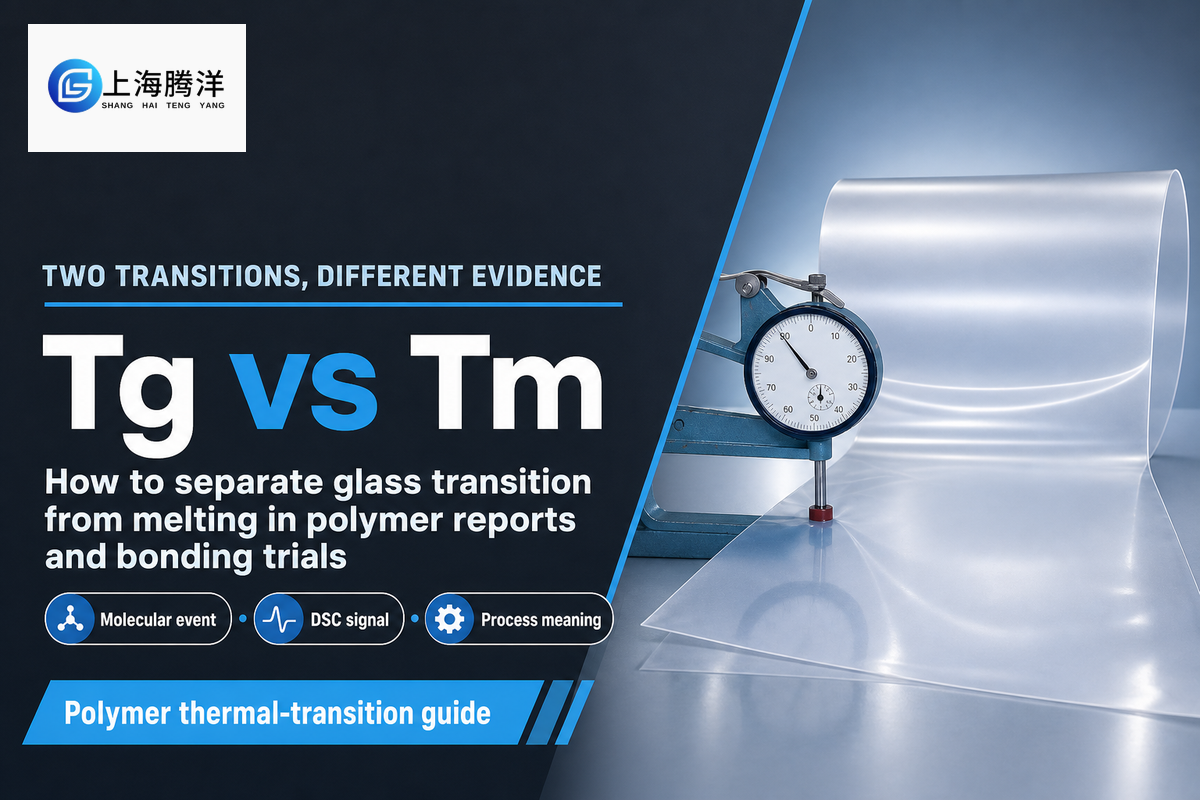
Glass transition vs melting point refers to the difference between two thermal events in polymers: the glass transition temperature (Tg), where amorphous regions gain mobility, and the melting temperature (Tm), where crystalline order is lost in a phase transition. Tg is associated with increasing mobility of amorphous (disordered) regions of a polymer, and is typically reported over a broad range of temperatures. Tm corresponds to the loss of crystalline order and usually appears as an endothermic peak or peak region. In thermal analysis, Differential Scanning Calorimetry (DSC) reflects the change in heat capacity of a polymer as a step function, and the melting event is represented by an endothermic peak.
Materials can exhibit Tg, Tm, both, or neither within a given temperature range. This is influenced by many factors like the material’s structure and chemistry, cross-linking, thermal history, and how the test is performed. Therefore, the temperature given on the data sheet should be viewed as a test result under certain conditions and not as a hard and fast rule.
Glass Transition vs Melting Point: The Quick Difference
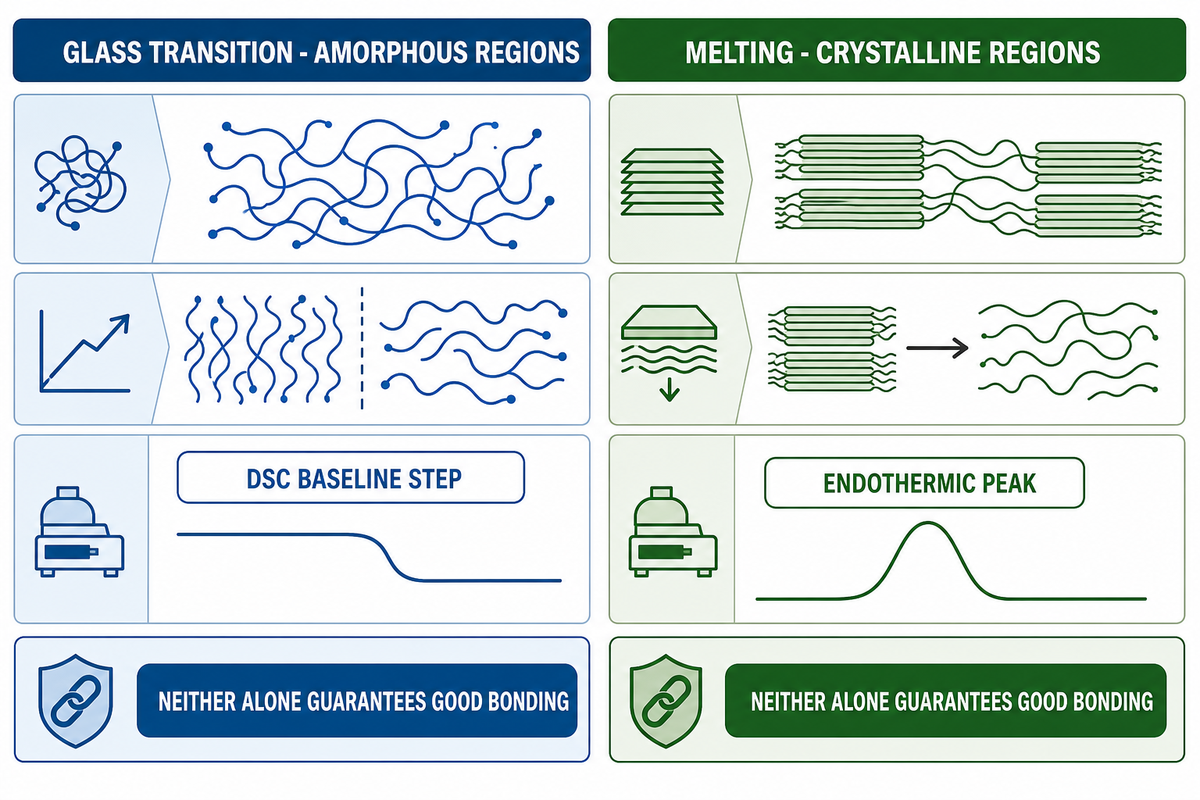
The main difference between the terms is in what part of the polymer changes, and what the instrument measures. The term glass transition is used for amorphous materials. The term melting is used for crystalline structures. The glass transition of a polymer is a range of temperatures over which the polymer changes its state from hard (glass like) to soft (like a rubber). During this transition, segmental movement of the polymer becomes possible on the experimental time scale. The melting of a polymer is an absorption of heat and a transition from an ordered crystalline state to a disordered melt.
| Comparison category | Glass transition, Tg | Melting, Tm |
|---|---|---|
| What changes? | Segmental mobility in amorphous regions | Long-range order in crystalline regions |
| Typical material response | Glassy behavior gives way to more rubbery or compliant behavior | Crystalline structures transform into a disordered melt |
| Typical conventional DSC signal | Baseline step associated with a heat-capacity change | Endothermic peak or peak region with an integrated enthalpy |
| Does it have one exact value? | Usually reported by a stated onset, midpoint, inflection, or other criterion | May be reported by onset, peak, or end temperature, depending on the method and purpose |
| Where is it expected? | Amorphous polymers and the amorphous fraction of semicrystalline polymers | Crystallizable polymers that contain crystalline material |
| Does crossing it guarantee good bonding? | No | No |
| Latent heat? | No melting latent heat; the characteristic DSC response is a heat-capacity change | Yes; melting absorbs heat that can be integrated as an enthalpy |
| Time-scale sensitivity | Strongly kinetic, so the apparent result shifts with method and rate | The measured onset and peak still depend on protocol, crystal population, and heating rate |
| Useful corroborating test | Dynamic mechanical analysis can track modulus and damping changes | X-ray diffraction can track the loss of crystalline order |
2 transitions, 2 parts of the structure. Most confusions about Tg arise due to misunderstanding of this simple concept. Above Tg, amorphous polymers can lose a significant amount of tensile modulus without losing their cohesiveness. At Tm, a polymer loses its crystallinity; whether it flows then depends on other factors, such as molecular weight, branching, crosslinking, and formulation. Flow properties of the polymer can also be affected by the test conditions and time. To relate polymer flow properties to test conditions and time, use Tengyang’s guide to heat, time, load, and polymer mobility as a process-decision framework.
What Happens to Polymer Chains at Tg and Tm?
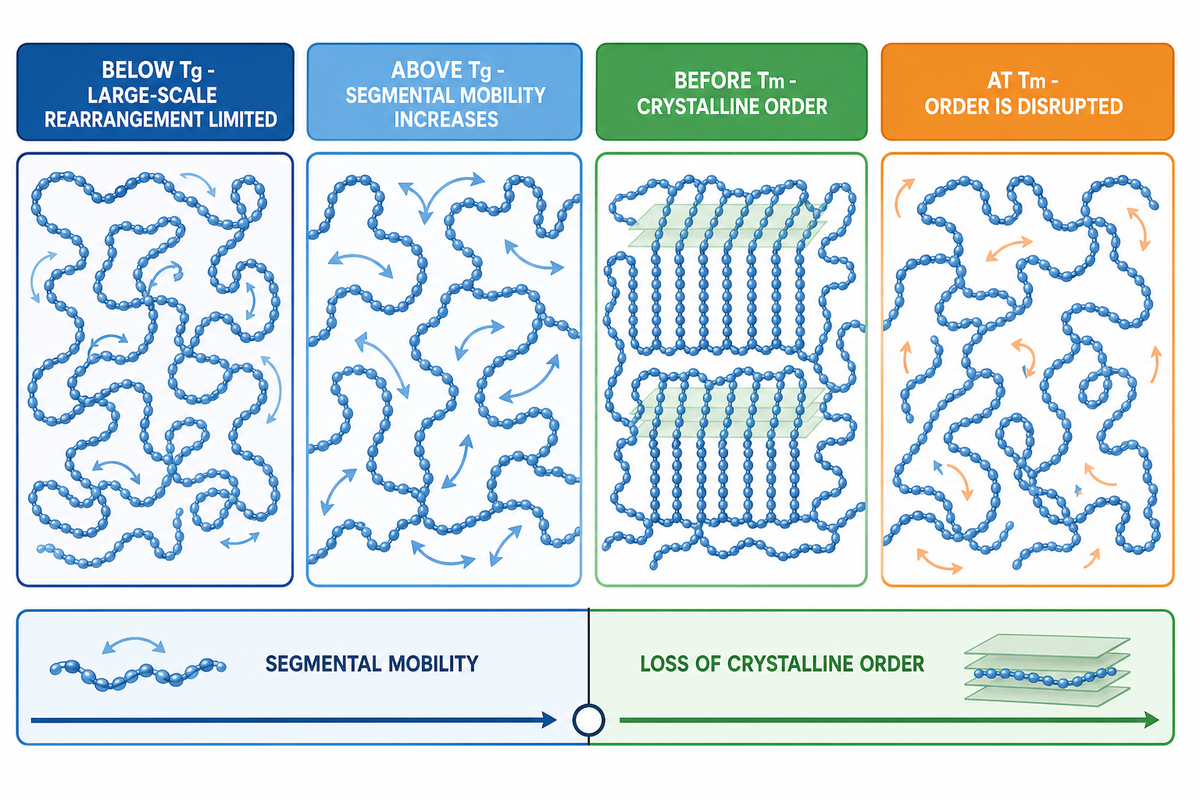
At Tg, amorphous chain segments gain mobility on the experimental time scale, so stiffness can fall without the polymer becoming a liquid. At Tm, ordered crystalline regions lose long-range order and absorb heat. A semicrystalline polymer can therefore show both events because amorphous and crystalline regions coexist.
Below Tg, the collective behavior of polymer chains limits large scale rearrangements on time scales observable in the experiment. Most people can intuitively understand a single molecule behaving in an orderly fashion. However, describing the behavior of a polymer in terms of single molecules can be misleading. The behavior is better described in terms of collective responses of chains (or segments) of molecules. One of the defining characteristics of glassy polymers is their stiffness. Depending on how the material is fabricated, polymers in the glassy state can also be hard and brittle. A polymer can be thermally energized above its glass transition. During this process, the polymer loses its stiffness and may become viscous. Mechanical properties of viscoelastic polymers reflect the relaxation of constraints on molecular level.
Melt processes are different from crystallization. Within crystal lamellae and small crystal sizes (crystallites), polymer chains have an ordered arrangement. During the process of melting, this ordered arrangement is disrupted. This requires an input of heat, which is measured as an endothermic event using DSC. The event is broad because of the variation in the imperfection of the crystals. Some crystals may contain defects that result in disruptions in the chain ordering, and therefore can require less heat and energy to disrupt. A semicrystalline polymer usually melts over a range of temperatures because its crystal populations differ in size, perfection, and thermal history.
This also accounts for the difference between Tg measurements from dynamic mechanical analysis and from differential scanning calorimetry. The dynamic mechanical analysis measures time-dependent properties of a material, e.g. modulus or damping. The differential scanning calorimetry measures the heat capacity of the material. According to the DoITPoMS teaching resource from the University of Cambridge, “there can’t be an exact value of Tg.” Exact values of Tg rely on numerous factors, including the rate of heating/cooling, frequency/strain rate, the history of the sample, and the standard/criteria used for the evaluation.
Do not substitute “softening point” for either transition. Softening temperature usually belongs to a specific deformation test under a stated load and geometry. Service temperature is an engineering limit for a defined requirement. Decomposition is chemical damage. Tg, Tm, softening, service limit, and decomposition can influence one another, but they are not interchangeable labels.
Which Polymers Show Tg, Tm, or Both?
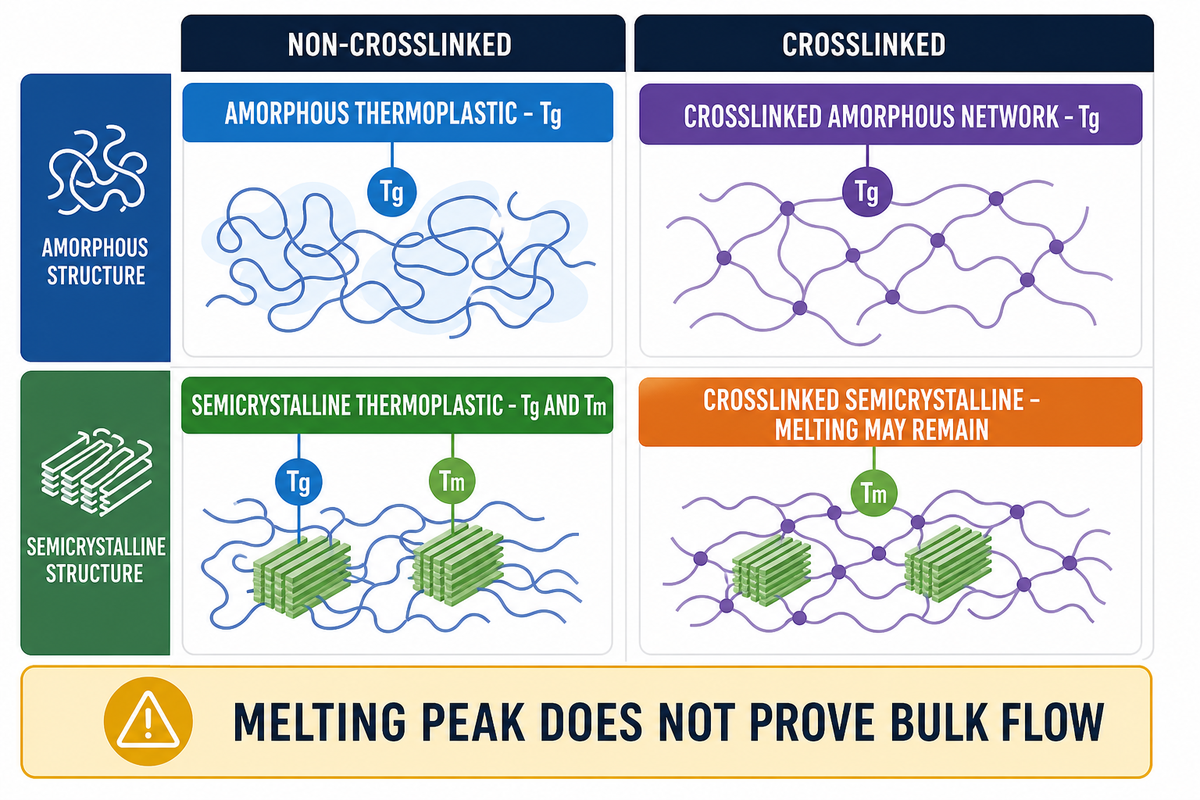
Amorphous polymers generally show Tg but no crystalline Tm. Semicrystalline polymers can show both Tg, from their amorphous fraction, and Tm, from crystalline regions. Crosslinked materials may also retain a crystalline melting response, although network topology can prevent conventional bulk melt flow. Morphology and topology must therefore be reported separately.
Use two separate axes: Amorphous versus crystalline morphology and crosslinked versus non-crosslinked topology. Combining them results in describing thermoplastics and thermosets using the same definition.
| Morphology and topology | Likely thermal observations | Important boundary |
|---|---|---|
| Non-crosslinked, amorphous thermoplastic | Tg; no true crystalline melting peak | It may soften and eventually flow over a broad temperature range, but softening is not Tm. |
| Non-crosslinked, semicrystalline thermoplastic | Tg in the amorphous regions and one or more melting responses from crystalline regions | The Tg step may be small because only the amorphous fraction contributes to it. |
| Crosslinked, mainly amorphous network | Tg; often no conventional bulk melt flow | Further heating may lead to degradation rather than processable melting. |
| Crosslinked, semicrystalline material | Tg may be present; crystalline melting and crystallization peaks can remain | A calorimetric melting peak does not prove that the crosslinked network will flow as a conventional melt. |
The last example is the most relevant here. Cross-linking and crystallinity aren’t pairs of opposites. A 2025 article reports melting and crystallization behavior of cross-linked polyethylene by DSC. Restricted mobility makes conventional melt processing and bulk flow unfeasible. Thus, the proper question is whether the material can relax and rearrange within the time frame of the experiment. This question is more appropriate than asking whether the material is a thermoset or a thermoplastic.
For a deeper look at mobility, test dependence, and practical interpretation, see Tengyang’s guide to how glass transition changes polymer behavior.
Step or Peak? How to Read Tg and Tm on a DSC Curve
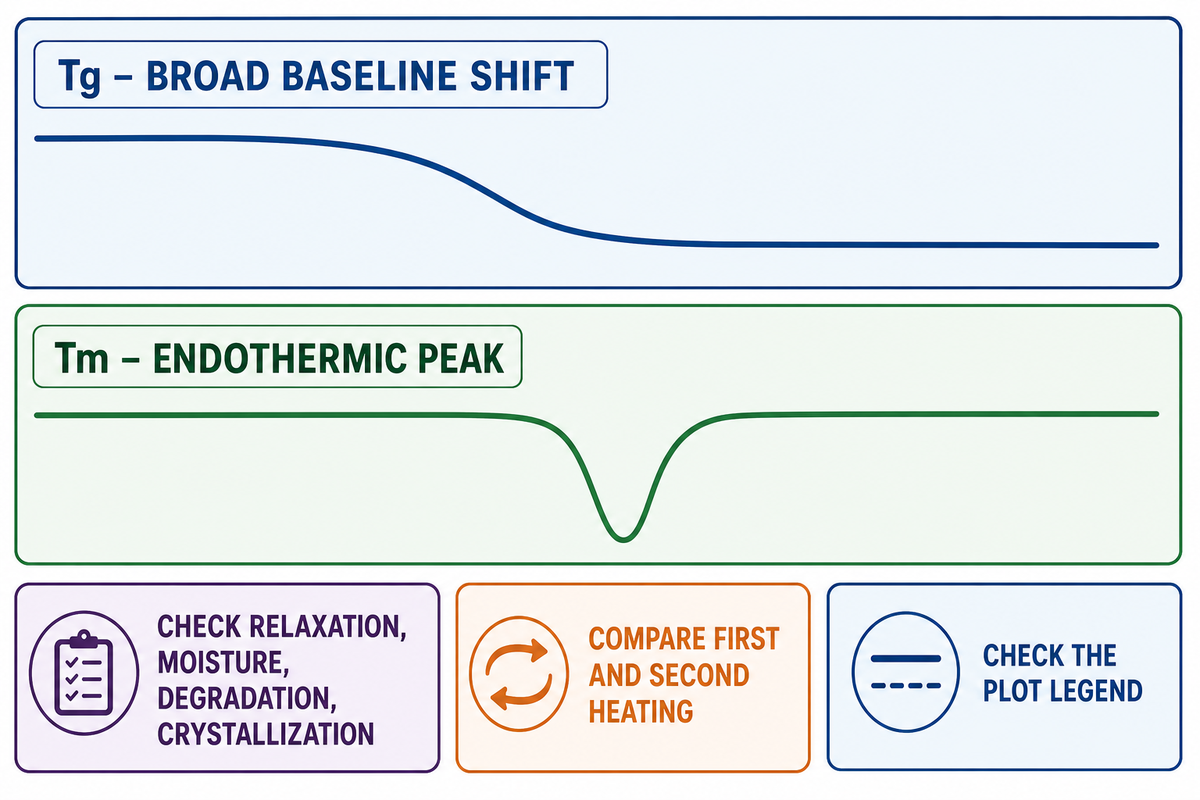
One good starting point is to determine the nature of the peaks and troughs in the DSC thermogram. A step in the baseline might be indicative of a change in heat capacity and therefore a transition. An endothermic peak might indicate melting, while an exothermic peak can indicate crystallization or reaction.
Run the Step-or-Peak Check:
- To determine the glass transition temperature of a material, look for a broad range shift in the baseline of the DSC thermogram.
- To determine the material’s melting temperature, look for a peak in the thermogram.
- Relaxation processes, loss of moisture, degradation, and/or crystallization can complicate and/or affect DSC thermograms.
- To interpret DSC thermograms, one has to have a broad understanding of the experimental design and the intended behavior of the polymer being studied.
- Look for differences in the first and second heating of a polymer.
There’s no universal direction for peak identification. An upward peak on one plot could represent a downward peak on another. Always check the legend before making a shape interpretation.
Current public method scopes reinforce the distinction. ASTM E1356-25 addresses assigning glass transition temperatures by DSC or differential thermal analysis. ISO 11357-2:2020 covers glass transition temperature and step height, while ISO 11357-3:2025 covers conventional-DSC melting and crystallization temperatures and enthalpies. Citing a standard’s scope is not a claim that a laboratory or product conforms to it.
Why Two Valid Reports Can Give Different Tg or Tm Values
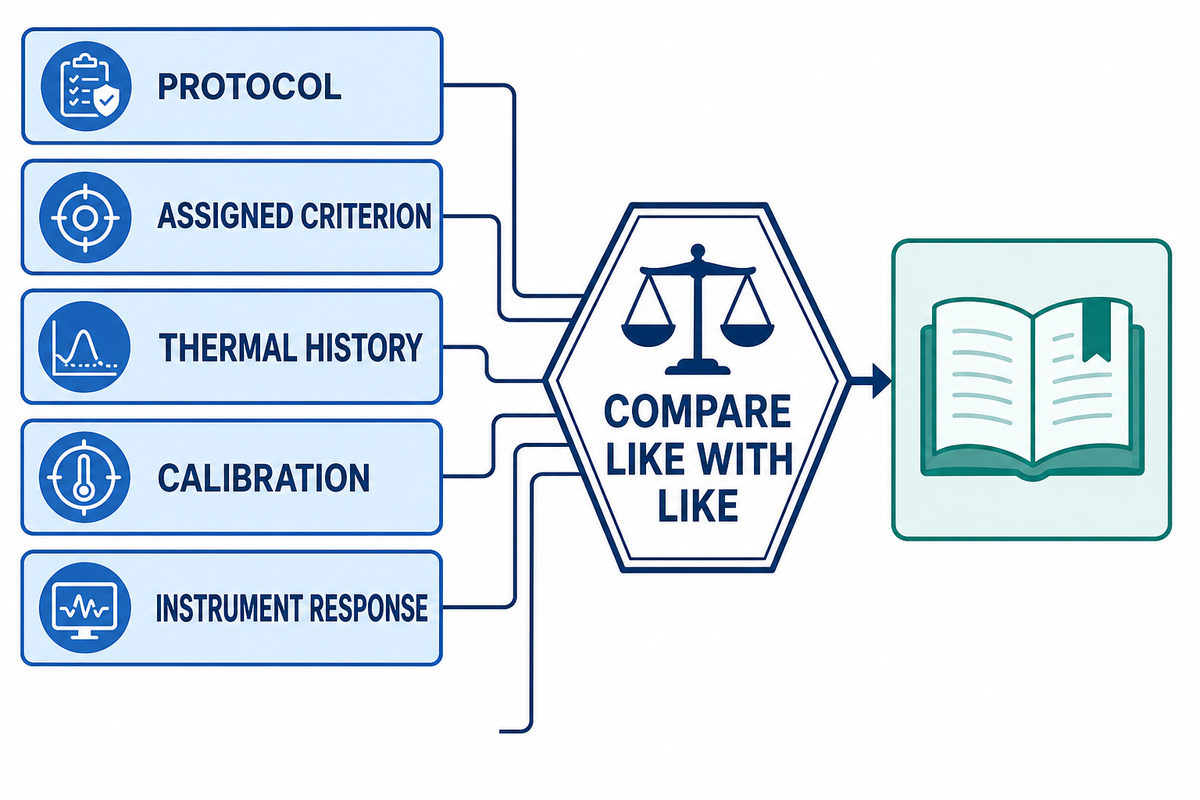
Different protocols can lead to different interpretations of the same property. Different test protocols therefore require different reported interpretations of the property. In the case of a melting event, the peak temperature could be reported, and in another case the temperature at the onset of the transition could be reported.
Several factors can affect the position and shape of a transition in a DSC trace including thermal history of the sample, sample mass, sample contact with the DSC pan, DSC calibration, baseline treatment, sample atmosphere, sample prior history (e.g. drying), and the response time of the DSC. Physical characteristics of the polymer (e.g. molecular weight, additives, moisture, aging, crystallinity, orientation) can also affect the transition.
In general, the first heat history of a sample reflects the previous processing and conditioning of the sample. In a comparative study, erasing the first history can help assess sample comparability. However, first history erasure doesn’t reflect the original condition of the sample.
Build a Three-Temperature File. Record the reported number, the criterion used to obtain it, and the temperature program that produced it. Add the specimen condition and whether the value came from first heating, cooling, or a later heating scan. A bare “Tg =” or “melting point =” entry is not enough for a defensible comparison.
What Can Be Mistaken for a Transition?
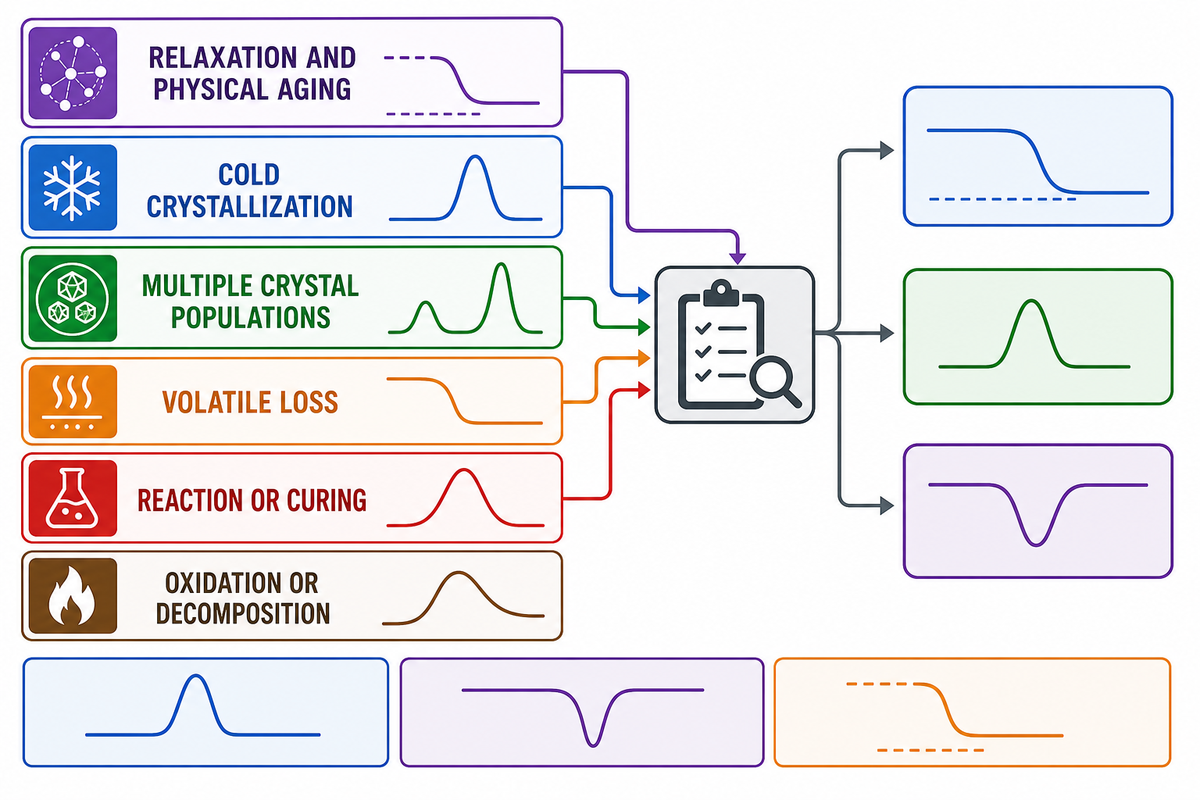
Changes during the cooling and heating of a material can be complicated. The relaxation and physical aging of a material can occur simultaneously. It’s common to see cold crystallization during the heating of a sample. It’s common to see a mixture of two or more populations of crystals in a material to have more than one melting point.
The peak broadening during the endothermic process can be the result of loss of volatiles. The exothermic process can be the result of a chemical reaction or curing. Peak distortion can occur due to oxidation or decomposition of the sample.
It’s common to see superposition during the heating and cooling of a material. The crystallization of a previously amorphous fraction can be seen during cooling, and cold crystallization can occur during heating. It’s important to have a material hypothesis to determine the reason behind a change in a material during a thermal process.
How Tg and Tm Inform Hot-Melt Adhesive Processing
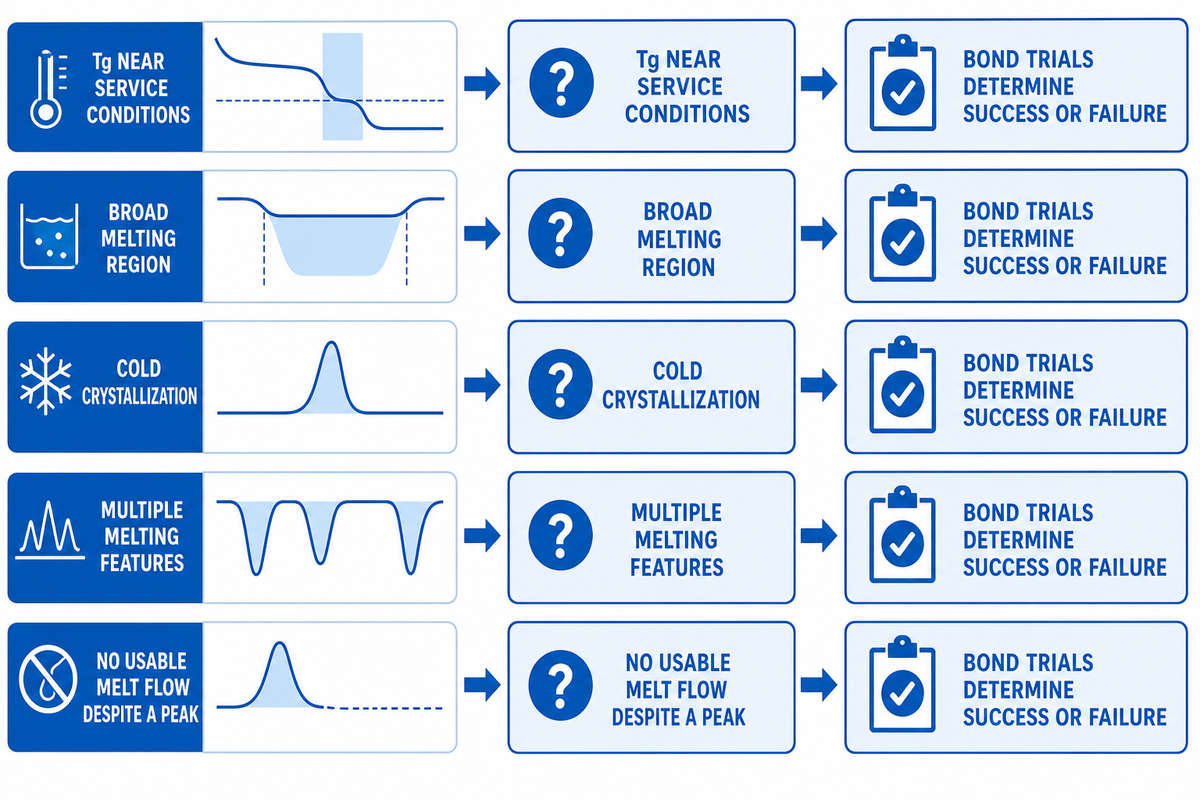
The glass transition temperature of a material can explain storage and use temperatures of a material. The glass transition temperature can also describe the loss of low-temperature material rigidity and the gain in low-temperature material flexibility of an amorphous material. The melting temperature of the crystalline phase of a hot-melt adhesive can be determined by DSC. To compare melting temperature and Tg within a hot-melt adhesive process, Tengyang’s Tg service-window screen organizes the crystalline-phase comparison without replacing DSC evidence.
For thermoplastic bonding to succeed, the adhesive needs to flow to fully make contact with the substrate. Viscosity and chemistry of the substrate, surface energy and roughness of the substrate, and the internal stresses of the adhesive all affect the outcome of the bonding. Interdiffusion and entanglements also take time. Excess heat can degrade the bond, and if not carefully controlled, the heat can damage the substrate.
| Curve clue | Process question | What to verify in trials |
|---|---|---|
| Tg near storage or service conditions | Will the adhesive layer stay flexible, become glassy, or creep under load? | Cold flex, peel or shear at use temperature, aging, and recovery after temperature cycling |
| Broad melting region | How wide is the practical activation window? | Bond-line temperature, dwell, pressure, wetting, squeeze-out, and substrate heat tolerance |
| Cold crystallization or scan reorganization | Does laboratory heating create morphology different from the supplied product? | First-heat behavior, real process cooling, set time, and post-bond conditioning |
| Multiple melting features | Are several crystal populations, phases, or histories involved? | Lot history, formulation, scan repeatability, and whether each feature affects processing |
| No usable melt flow despite a peak | Is a crosslinked or reactive network restricting flow? | Rheology, gel content where relevant, actual wetting, cure progression, and degradation limit |
Thermal analysis can help determine bond success and failure. A thermal curve allows us to narrow our scope and focus on the variables that we can control. It’s important to understand the morphology and molecular weight of the polymers of the same family. Avoid making assumptions about the bonding characteristics of polymers simply because they belong to the same family.
How to Report Thermal Data and Request an Adhesive Recommendation
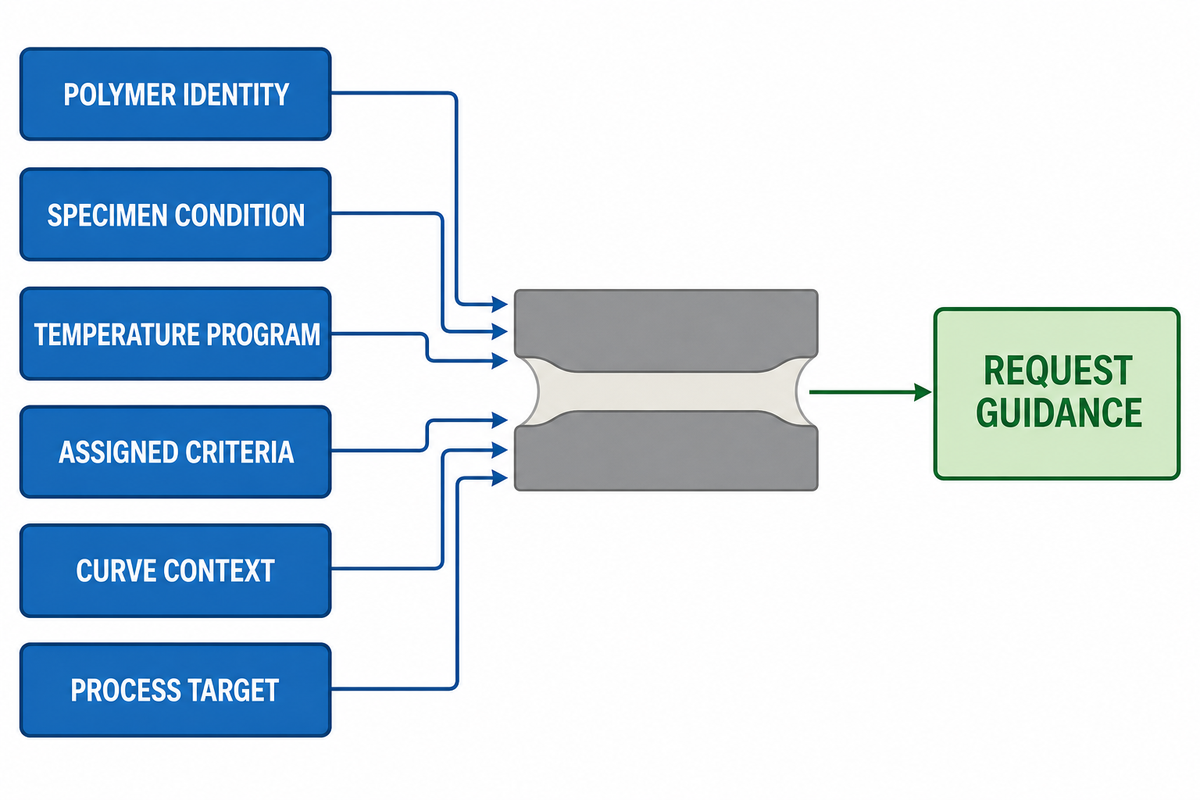
Thermal analysis produces many types of data. In this report, we focused on the thermal analysis of bonds and the polymers of the bonds. To connect this thermal analysis of polymers and bonds to an application-specific handoff, Tengyang’s bonding requirement builder organizes the required process inputs.
- Record polymer identity: family, grade, lot, and formulation. Also state if the specimen is a bonded specimen.
- Specimen condition: thickness, mass, sampling location, orientation, drying, storage, conditioning, and prior mechanical history.
- Temperature program: start and end temperatures, heating and cooling rates, holds, atmosphere, and cycle number.
- Assigned criteria: what temperatures were reported? Reported criterion: Onset or offset of a transition?
- Curve context: relaxation, crystallization, multiple peaks, moisture loss, reaction, or degradation that could affect assignment.
- Process target: substrate pair, bond-line temperature, available dwell and pressure, production speed, cooling conditions, and performance test.
Shanghai Tengyang produces hot-melt adhesive products in the forms of films, webs, powders, and granules based on TPU, EVA, PA, PES, and PO. For Shanghai Tengyang hot-melt adhesive products in film, web, powder, and granule forms, application support services begin with the actual substrates and process conditions. We review and consider various product parameters including thickness, width, color, and the manner and temperature at which the product melts. We can produce adhesive products to suit specific application needs. Our suggestion requires evaluation of the actual substrate and process conditions. This may require sampling and on-site testing of product application.
Review your bonding request with Shanghai Tengyang. Submit sample pairings, process temperatures, pressures, required dwell times, the desired width and thickness, and your end-use testing requirements. The team can suggest appropriate adhesive materials and help plan your trial bond.
Email: Betty@hotmeltmaterial.com | Tel / WhatsApp: +86 13122233268
Frequently Asked Questions
What is the difference between Tg and Tm in polymers?
Tg marks increasing segmental mobility in amorphous regions and usually appears as a heat-capacity step over a temperature range. Tm marks loss of crystalline order and usually appears as an endothermic peak or peak region. Neither value alone defines processing temperature, service temperature, or bond performance.
Tg denotes a change in mobility and occurs over an amorphous region and appears as a step in the heat capacity. It can also be accompanied by a broadening of the peak in the DSC trace. Tm denotes the loss of long-range order and appears as an endothermic peak. Amorphous polymers usually exhibit Tg, but not Tm. A semicrystalline polymer can exhibit both Tg and Tm because it contains amorphous and crystalline regions. For semicrystalline polymers, compare Tg and Tm values only when the method, scan direction, heating rate, and assignment criterion are reported. Tg is usually lower than Tm. A semicrystalline polymer that hasn’t reached its Tm can still have amorphous regions above Tg, so it need not be in a uniformly glassy state or have little flow. Like Tg, Tm is temperature- and method-dependent.
Does a polymer become liquid at its glass transition temperature?
No. Above its glass transition temperature (Tg), segmental motion increases, and amorphous polymers may become rubbery and more compliant. This isn’t crystalline melting. Whether a material at its Tg flows depends on various factors such as the average molecular weight of the polymer, the type and level of any chemical or physical crosslinking, and the extent of any molecular entanglements. Additionally, the ambient conditions (i.e. temperature, time scale, and rate of deformation) must be considered.
Can a thermoset have a melting point?
Cured thermosets do not have a conventional bulk melting point because crosslinked networks cannot rearrange like uncrosslinked thermoplastics. Retained crystalline regions may still produce a measurable DSC melting response. That peak describes the crystalline fraction, not a conventionally remeltable processing network.
A chief characteristic of thermosets is that, once cured, they can never fully re-melt. The same isn’t true for a thermoplastic. A crosslinked semicrystalline material can retain crystalline regions that show a melting response in DSC without conventional bulk melt flow. A thermoset may contain microregions of crystallinity that are accessible to calorimetric melting without enabling conventional bulk flow. Such a region may melt at its own melting temperature, but raising the system above that temperature does not give the thermoset normal bulk melt flow.
Why is Tg sometimes reported as a range?
Tg spans a range, unlike a melting point, because glass transition is kinetic and method-dependent. Heating rate, thermal history, test frequency, specimen condition, and the selected onset or midpoint criterion can shift the reported value. Comparisons therefore require stated methods, conditions, and criteria.
Glass transition occurs over a range and is dependent on test method, rate, history, and whether the onset, midpoint, or other point is analyzed. Report the criteria and the range when literature comparison is needed.
When reporting properties of polymers or polymer blends, note the preparation method because it can impact Tg and other properties; a reproducible method supports useful comparisons across applications. For example, Tg values for many commercial polyolefin blends are determined by DSC after the blends are prepared by common polyolefin processing methods. The same approach can be used with other classes of polymers.
Is melting point the same as the processing temperature of a hot-melt adhesive?
No. While melting data may assist in identifying transition behavior in crystalline materials, the usable process window is impacted by a number of other variables including melt viscosity, wetting, pressure, dwell, adhesive thickness, the substrate’s tolerance to heat, cooling, and crystallization. Only by measuring or controlling the bond-line temperature can the window be defined. The setting recommended should be validated by the measurement of the bond-line temperature.
References & Sources
- ASTM E1356-25 official public scope for assigning glass transition temperatures by DSC or differential thermal analysis.
- ISO 11357-2:2020 official public scope for determination of glass transition temperature and step height.
- ISO 11357-3:2025 official public scope for conventional-DSC melting and crystallization temperatures and enthalpies.
- Engineering LibreTexts: Amorphous and Semi-Crystalline Polymers, by Steimel. Link in background. Graphs Tg and properties of various semi-crystalline polymers, e.g. polypropylene.
- Penn State MATSE 202: Differential Scanning Calorimetry is a teaching resource on labeling conventions and analysis of DSC thermograms.
- Journal of Thermal Analysis and Calorimetry (2023) presents peer-reviewed analysis of glass-transition evaluation and protocol-dependent results.
- Crosslinked polyethylene thermal study (2025) peer-reviewed evidence that crosslinked semicrystalline specimens can retain melting and crystallization behavior.
- Fast-calorimetry study of overlapping polymer transitions peer-reviewed evidence on relaxation, crystallization, reorganization, and melting overlap.
- Scientific Reports thermoplastic heat-fusion study evidence separating interface time-temperature history, diffusion, entanglement, and mechanical response.
- University of Cambridge DoITPoMS: Glass Transition in Polymers: Online educational material regarding the glass transition temperature of polymers, time and methodology.
Technical note: This article is educational.
ABOUT TENGYANG
Industrial hot melt adhesive materials for bonding routes
Shanghai Tengyang New Materials Technology Co., Ltd. supports material discussions for production teams working with bonded products.
Available forms: hot melt adhesive film, web, powder and granules. Material families: TPU, EVA, PA, PES and PO.
CONTACT PROFILE
Betty Fang
Contact for material inquiries.