Get in touch with Tengyang Company

Thermomechanical analysis measures dimensional change under a known load as a sample is heated or cooled. Expansion, penetration and deformation are different modes of measurement. Read the curve with its probe, force, dimensions and thermal programme; motion becomes a material property only once the mode and analysis are defined.
An adhesive film can get longer, shorter or let a probe sink into it. Movements like these may appear similar on a chart but require different actions to be taken. It may not always be true that what’s measured is what’s desired; before comparing adhesive films, establish what the instrument actually measured. Otherwise, quality control can mistake a change in test conditions for a change in material.
At a glance
- Use expansion data for a coefficient only where probe indentation and other deformation are negligible.
- Report penetration or softening with its load and criterion; a downward trace can be softening, deformation, stress relief or shrinkage, not only melting.
- Keep film direction, backing, moisture conditioning and thermal history with every comparison.
- Ask for raw curves and measurement repeatability before ranking close results.
Quick Specs: what belongs on the report
| Measured channel | Displacement in μm or mm; define its sign |
|---|---|
| Applied load | Force in N or mN, with tip or fixture geometry |
| Thermal programme | Temperature in °C, ramp in °C/min, holds in min |
| Expansion result | Mean coefficient in K⁻¹ or ppm/K over a stated interval |
What thermomechanical analysis measures
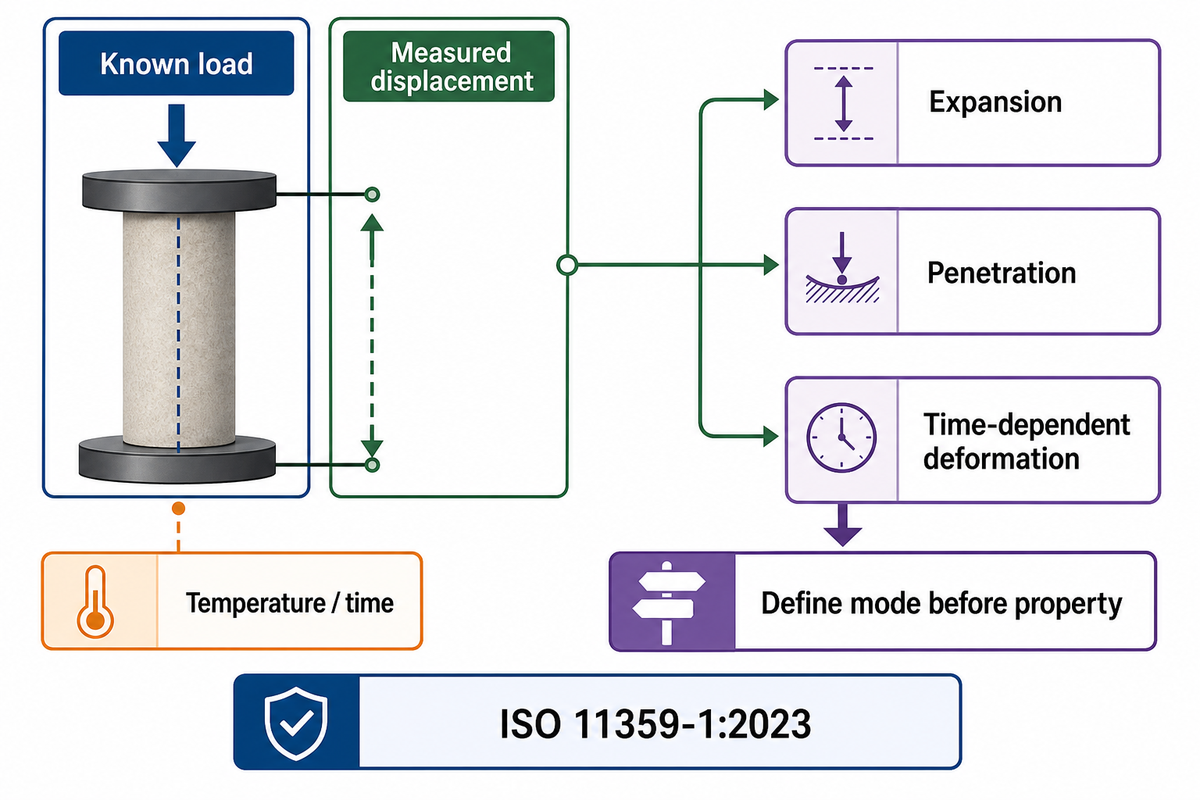
Thermomechanical analysis measures how a sample changes dimension with respect to controlled loading and temperature conditions. The primary output is motion, often displacement, with respect to time and/or temperature. A property of a material is defined only after the measurement mode and analysis are defined. The same movement channel can describe thermal expansion, penetration or time-dependent deformation.
ISO 11359-1:2023 describes deformation under constant load as a function of temperature and/or time. The instrumentation of a thermomechanical analyzer brings together temperature control, a specimen holder, a loading system and a displacement sensor. A linear variable differential transformer, or LVDT, is one way to detect the probe’s motion.
Displacement detection and property calculation are distinct steps in a measurement chain. North Dakota State University’s instrument description states that displacement is the measured response. The historical US5710426A analyzer patent describes an optical encoder coupled with drive-force information. It’s an instrument design submitted by TA Instruments, and not evidence of a TengYang test or ownership of that technology.
What is TMA used for?
TMA is used to characterize dimensional change during heating, cooling or a hold under a known load. Common queries are regarding expansion coefficients, glass-transition behavior, penetration softening and deformation over time. Here, TMA refers to an experimental measurement. A computational thermomechanical analysis, on the other hand, computes thermal and mechanical behavior using materials and boundary conditions.
The test can support research and development or help investigate a changed production sample. By itself, the test can’t certify a finished bond. Dilatometry tracks dimensions while the specimen is heated or cooled. A dilatometer provides the measurement; thermodilatometry is the technique. Sintering processes in powders and dimensional tests on polymer films require different specimen arrangements. Those industrial applications share a temperature axis, but their methods remain distinct.
Practical applications of TMA are dependent on a well-defined dimensional question. A request for a report leaving too much open to interpretation shouldn’t be accepted. State what’s being investigated, whether fit, softening under contact or movement during a hold. Ask the lab to state its mode before accepting a quote. A data sheet showing a wide temperature range establishes an instrument capability, not the conditions suitable for the supplied film.
Cornell’s Q400EM facility listing gives a loading range of 0.001–1.0 N. That range belongs to the listed instrument. A film comparison still needs its actual applied force, contact geometry and criterion recorded; selecting a number within the hardware range doesn’t validate the method.
Probe geometry and load: expansion, penetration and deformation
Coupling of the instrument to the specimen is determined by the shape of the probe and the load. An expansion contact should follow a dimension without materially indenting it. A penetration probe is designed to enter a specimen of a softening sample. Tensile, compression, and flexural arrangements measure loaded response. Curves for these arrangements shouldn’t be compared as if they measure the same property, because that discards the mechanical conditions for the test.
ASTM E831-25 requires sufficient rigidity across the test range so that the sensing probe does not indent the specimen. By contrast, ISO 11359-3:2026 concerns penetration temperature. Choose the physical question first, then choose the probe and analysis techniques.
What load is applied in TMA penetration mode?
Penetration-mode TMA typically applies 5–50 mN through a sharp-tipped probe, according to one testing-laboratory guide, though the right load for a given polymer film can differ. The load is dependent on the shape of the probe, contact geometry, thickness of the specimen, support and the method. Testing conditions should be explained in a lab proposal to show why they suit the material and whether the applied load causes movement before heating. The actual load should be reported.
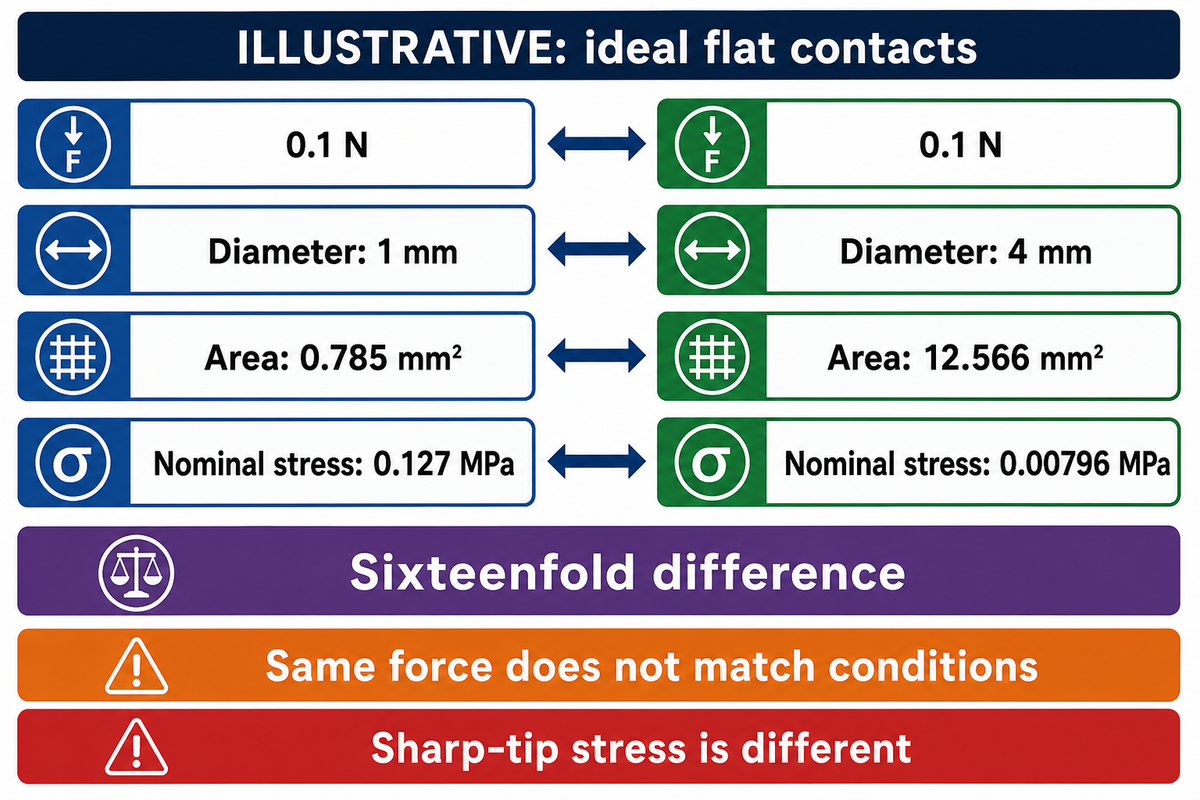
Contact stress isn’t described simply by the force. For an ideal flat circular contact, nominal stress is force divided by area. A pointed tip has evolving contact as it penetrates, so that simple calculation does not establish its local stress distribution or a material acceptance limit.
Consider an illustrative quality engineer comparing two lab proposals. Both specify 0.1 N, but one uses a flat 1 mm diameter contact and the other a flat 4 mm contact. The areas are πd²/4: about 0.785 mm² and 12.566 mm². Dividing the force by those areas gives nominal stresses of 0.127 MPa and 0.00796 MPa, a sixteenfold difference. The engineer can’t accept “same load” as proof of matching conditions. The next request is the actual tip geometry, support and room-temperature loading response. These numbers demonstrate geometry only; they neither recommend that force for adhesive film nor calculate the changing stress beneath a sharp penetration tip.
Probe-to-Property Decision Map
Annotate this map to show the location of the requested signal and its main confounder. The nine rows refer to distinct questions or setups, not to the nine standard methods. Confirm the method with the laboratory.
| Question or setup | What to request | Interpretation limit |
|---|---|---|
| Rigid solid, expansion contact | Length change and fitted interval | Indentation invalidates a simple expansion interpretation |
| Thin film, in-plane tension | Gauge length, axis and load | Stretching or slip can overlap expansion |
| Film, through-thickness contact | Thickness direction and reference height | Compression may dominate the small height change |
| Film on a backing | Complete layer stack and support | The assembly constrains the film |
| Penetration during a ramp | Tip, force and onset criterion | Operational softening is not an automatic melting result |
| Compression during a hold | Displacement against time at fixed conditions | Creep is not a temperature slope |
| Tension during a hold | Extension, time and loading history | Residual set and creep need separation |
| Three-point flexure | Span, dimensions, load and deflection | A different fixture needs a different analysis |
| Repeat heating after cooling | Both runs and the cooling programme | The second run represents changed history |
Source basis: Matney’s Los Alamos TMA literature review and currently valid public method scopes. A movement channel can include several effects. The map is a scoping aid, not a conformity certificate.
At an illustrative 0.1 N, changing an ideal flat contact from 1 mm to 4 mm diameter reduces nominal stress by sixteenfold. Matching the force label therefore leaves an important comparison unresolved. Keep the dimensions of the contact, as reported, and check the specimen deformation before interpreting a slope as an expansion.
Thermal expansion and the coefficient of thermal expansion
The coefficient of thermal expansion measures changes in length relative to an established reference length and temperature change. A mean value describes a stated interval; it is not the raw slope in millimetres per degree. State the measurement axis and the interval for which the fit was accomplished. If the curve is crossing a transition, showing creep, or indenting, you must analyze that before you do the calculation.
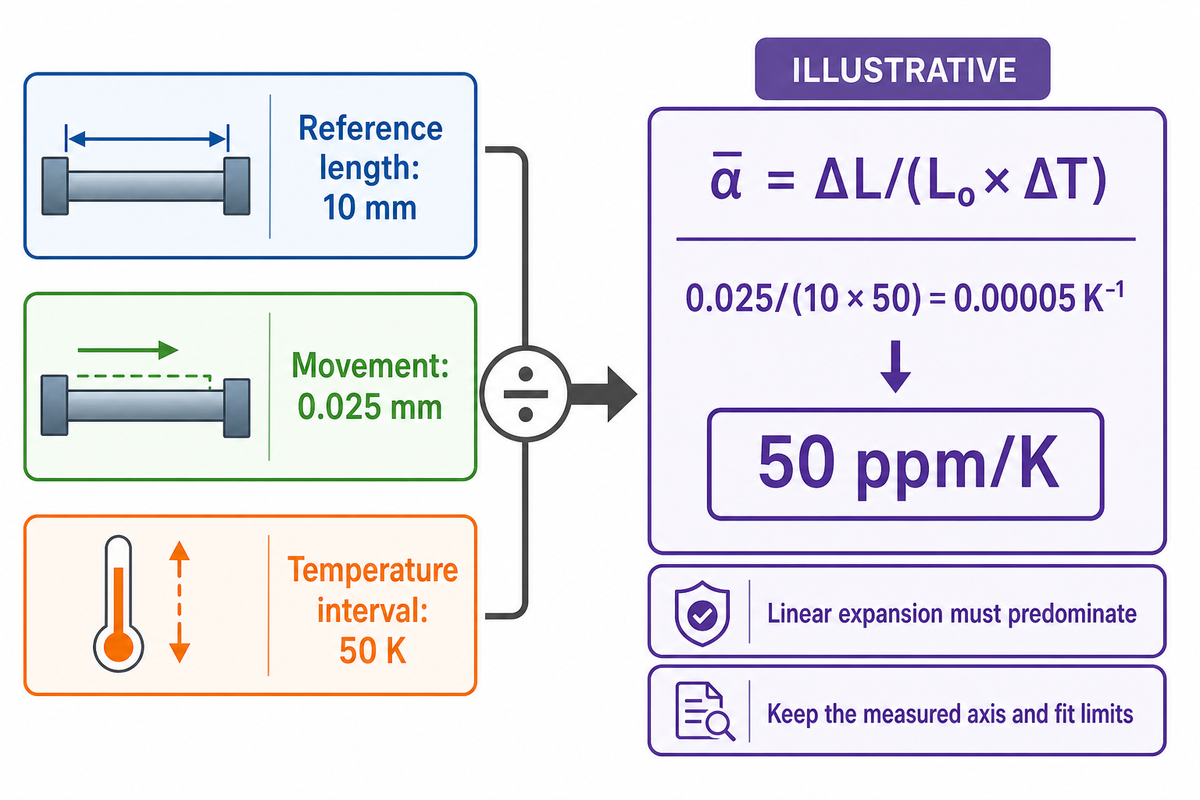
For a finite interval, ᾱ = ΔL/(L₀ × ΔT). Keep the reference dimension beside every coefficient. The units are K⁻¹; ppm/K multiplies that value by one million. A difference in a Celsius temperature has the same absolute value as a difference in kelvins. The reference length L₀ must belong to the measured direction, not whichever specimen dimension is easiest to find.
Consider a lab trace that shows a 10 mm reference length, and rises 0.025 mm over a 50 K temperature interval. The mean expansion coefficient is 0.025/(10 × 50) = 0.00005 K⁻¹, or 50 ppm/K. If a buyer only sees the 0.025 mm movement, he/she may pick a wrong material, based on comparisons with movements of other specimens. Instead, the buyer asks for both reference dimensions and the fitted temperature intervals. Only if the linear expansion of that part was predominant during the test is the calculation useful. A penetrating contact, a shrinking oriented film or a transition inside the selected interval cannot be corrected merely by dividing the same movement by length.
Thermal expansion and contraction describe movement; a coefficient also needs normalization. A mean coefficient follows a finite interval, whereas an instantaneous coefficient describes local behavior. Temperature variation can change the slope, especially across a glass transition. Ask if the lab reports a tangent-based value, a mean coefficient, or two fit intervals. A single number without definition can mask the difference.
E831-25 gives a recommended lower coefficient limit of 5 μm/(m·°C) and a stated range of −120°C to 900°C. If coefficients are lower or negative, they can be measured with reduced accuracy and precision. These are the boundaries of the public method; the lab needs to use suitable instrumentation and calibrate it for the intended range.
If two values, e.g., ppm/K, differ by a small margin in a procurement, the purchaser may consider the difference an apparent ranking. Ask the laboratory if the difference is beyond its repeatability and bias for those conditions. More decimal places don’t resolve that difference. Various temperature measurements, the selected interval, and reference length all affect the calculation.
A 10 mm specimen moving 0.025 mm over 50 K gives an illustrative mean coefficient of 50 ppm/K. The arithmetic shows the type of normalization needed for CTE measurements, but it doesn’t show that the movement was thermal expansion. A reasonable report would also show the measured axis, fit limits, and conditions that prevent indentation.
Softening, shrinkage and first-heating curve changes
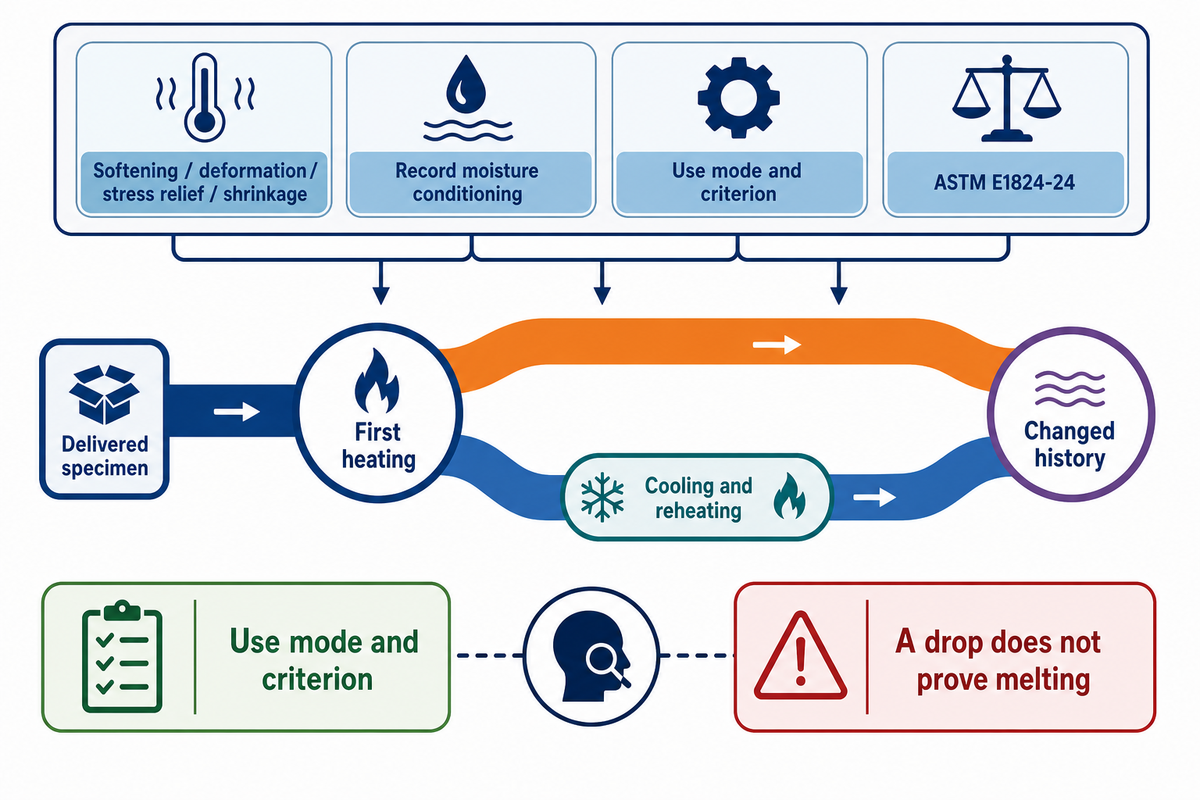
Downward movement or change in slope can include softening, mechanical deformation, stress relief or shrinkage. Thermal history and moisture conditioning can alter that response. Assign the event using the loading mode and stated criterion, supported by other measurements where necessary. Naming every drop “melting” loses the distinction between a thermal transition and movement under force.
ASTM E1545-22 assigns glass transition temperature under compression. Its public scope requires a fair amount of rigidity below the transition to prevent indentation. The tension method’s published explanation in ASTM E1824-24 lists interacting expansion, reduced modulus, stress relief and physical aging effects. A typical trace may incorporate all of the above.
“This method can also be used to measure the softening point.”
The first heating can disclose the processing and storage history of the specimen. History of relaxation behavior or crystallization may change with heating, cooling and reheating. Retain the first run when the question concerns the delivered material; a second run after a defined cycle answers a different question. Evidence of a processing history shouldn’t be erased to produce a smoother trace.
In a published 1998 failure investigation, analyst Michael Sepe examined glass-filled ABS caps that cracked after filament winding. Composition and other checks didn’t explain the difference between acceptable and failed parts. TMA samples from the gate region behaved differently: near 115°C, the failed specimen had expanded about twice as much as the acceptable one. Sepe explained the behavior by suggesting that the parts were made with molded-in stress which, combined with solvent exposure, could account for the part failure. He demonstrated that the part failure could be prevented by a process called annealing. The practical lesson is to preserve the location and processing history of the specimen. This is Sepe’s historical ABS case and not a case study involving copolyester adhesive film.
Moisture is another state variable. Knauss and Kenner’s PVAc study links absorbed water to swelling and creep. A filled-epoxy research abstract reports additional shrinkage as dry gas removes moisture. Those materials establish possible mechanisms, not the size of an effect in a different film. Keep storage and drying conditions with the sample; our guide to interpreting moisture uptake paths explains that separate measurement.
If a second lab states that it will perform extra heating cycles or drying, ask what decision that preparation serves. For a delivered-film comparison, agree on a defined as-received condition as well as any conditioned run. In general, an extra test may be desirable, but it changes the state of the specimen being compared.
Caltech’s PVAc research compared dry material with storage at 92% relative humidity and found moisture-dependent creep and swelling. That condition is part of the published PVAc work. For another polymer, conditioning must be specified and checked; neither its humidity level nor its response magnitude becomes a universal film-test requirement.
Thin films, substrates and measurement direction
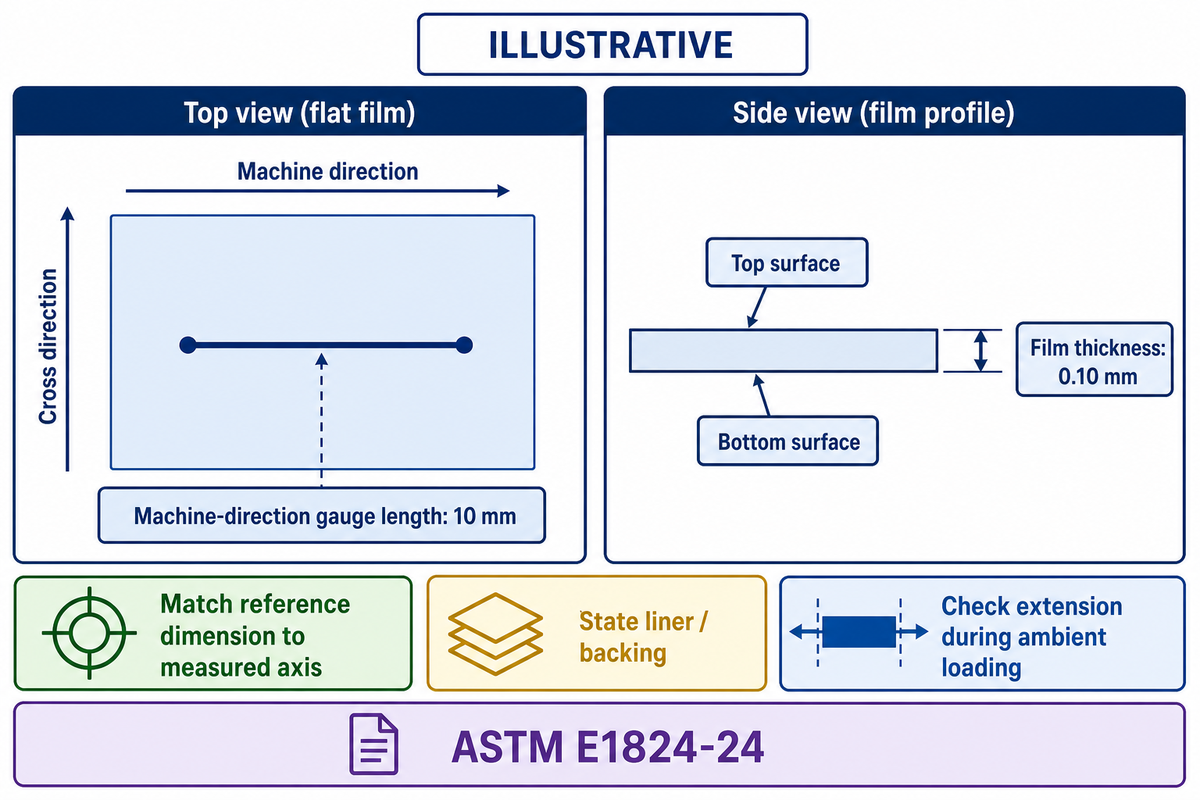
Extension in the plane of the film and through-thickness movement are defined by different reference dimensions and constraints. A free film behaves differently than a film that’s bonded to a substrate. In addition, machine and cross directions may behave differently. Before comparisons are made, clearly state the complete construction and orientation of the specimen being tested. A resin name doesn’t define the dimensional response of an assembly.
How does TMA measure CTE in two directions?
A TMA test run is defined by the dimension selected by its fixture and the specimen orientation. For a comparison of two film directions, prepare and label separate axis-specific specimens. Use validated conditioning. In-plane extension and through-thickness contact require different reference dimensions. Two curves become comparable after analyzing the loads and geometry, preparation and fitted intervals.
A thin free film can buckle under compression or stretch in tension. Backing may prevent one movement while imposing another constraint. The tension discussion in the Los Alamos review references films and fibers. ASTM E1824-24 adds an important boundary: its tension method requires sufficient rigidity to inhibit extension during ambient-temperature loading. Just because a specimen fits in a fixture doesn’t mean the specimen meets that condition.
E1824-24 states that a range of 25°C to 600°C is generally applicable, and is subject to instrumentation. That range doesn’t ease the condition on ambient-loading or define a film’s service temperature. Ask the lab which part of that range is applicable to the specimen being tested and the decision.
Imagine an illustrative 0.10 mm film held at a 10 mm gauge length. Its thickness can’t be substituted for the tensile reference length. In a thickness direction test, the starting height can’t be at the 10 mm gauge length. A labelled 2D sketch can communicate the two in-plane directions. Mark the machine direction on the roll sample provided, and indicate the cross direction. Indicate if the release liner or the backing is still attached.
Prior to purchasing a full test series, ask the lab to show their specimen loading check and their specimen mount. If a nominal 0.10 mm free film already extends appreciably under the proposed force, request a justified alternative or qualify the intended result. Avoid paying for a precise-looking coefficient whose measured motion includes an uncontrolled mechanical contribution.
Using a 0.10 mm thickness instead of a 10 mm tensile gauge length changes the illustrative normalization denominator by a factor of one hundred. Bookkeeping mistakes of this nature can overwhelm a real material difference before questions about backing, orientation or specimen compliance are raised.
TMA vs DSC and dynamic mechanical analysis
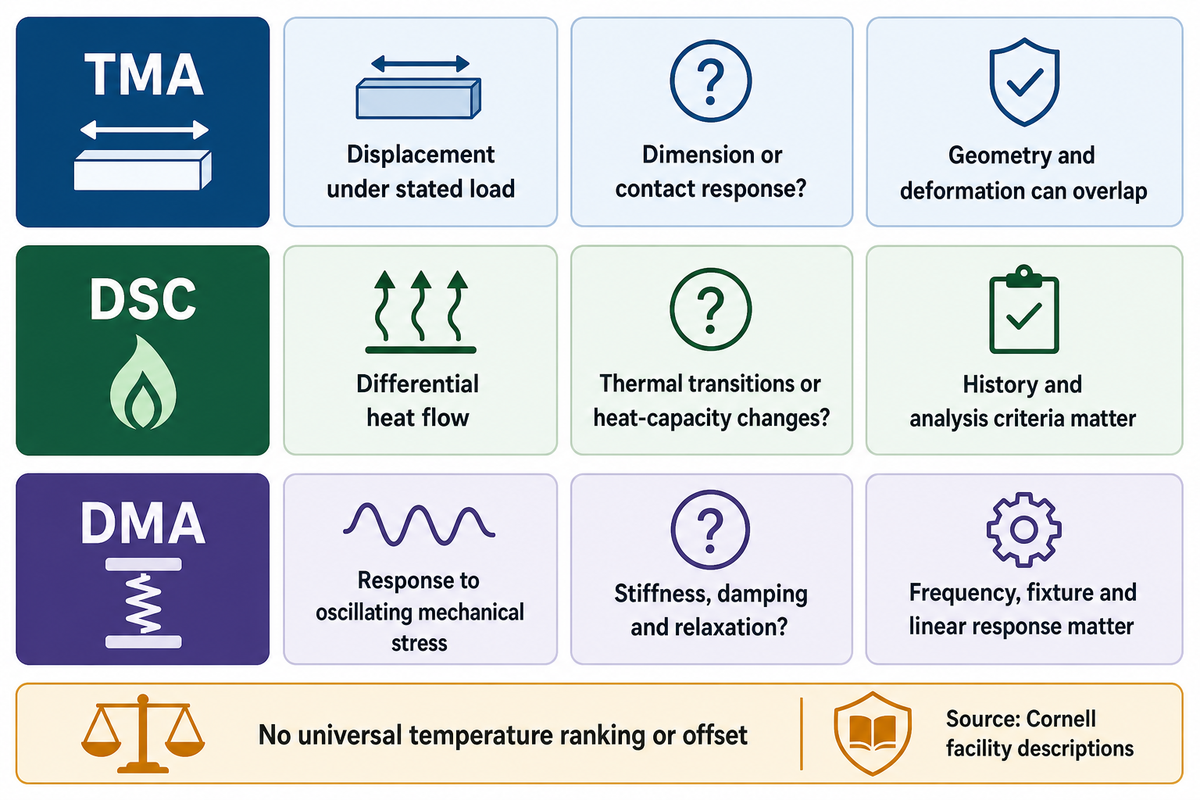
TMA detects dimensional response, differential scanning calorimetry detects heat flow and dynamic mechanical analysis detects a response to oscillatory loading. Each detects a different aspect of a transition and uses a stated criterion. Results may complement each other; one testing-laboratory guide puts DMA Tg typically 10–20°C above DSC Tg, with TMA Tg in between, but that spread is not a fixed offset.
Breaks in the slope of the expansion line and the viscoelastic loss peak are different observations. A reported transition is accompanied by its method, heating rate, frequency where relevant, and definition of the onset or peak. A chosen measurement may answer the application question, but separate glass transition from a melting event.
| Method | Measured response | Useful question | Boundary |
|---|---|---|---|
| TMA | Displacement under stated load | How does a dimension or contact response change? | Geometry and deformation can overlap the thermal signal |
| DSC | Differential heat flow | Where are thermal transitions or heat-capacity changes? | Thermal history and analysis criteria remain important |
| DMA | Response to oscillating mechanical stress | How do stiffness, damping and relaxation depend on temperature/frequency? | Frequency, fixture and linear-response conditions matter |
Source basis: Cornell’s characterization facility descriptions, the Los Alamos review and the public TMA scopes. Specialized dynamic or modulated TMA modes exist, but an ordinary expansion trace isn’t automatically a modulus spectrum.
Time dependence means that a loaded specimen can deform during a hold at elevated temperature. Elasticity is concerned with the recoverable response; creep and stress relaxation are concerned with different controlled conditions. For a more complete description of polymer response, see viscoelastic response and time dependence. The tests named Heat distortion temperature or heat deflection require a specified fixture and criteria rather than a borrowed term from a softening curve.
A buyer wanting processing heat demand should request calorimetry and appropriate normalization. Our heat-capacity baseline guide addresses this separately. Thermal conductivity relates to heat transport; a displacement curve doesn’t measure it. Select the required output before you ask a laboratory for its full menu of thermal analysis tests.
From a TMA curve to an adhesive-film trial
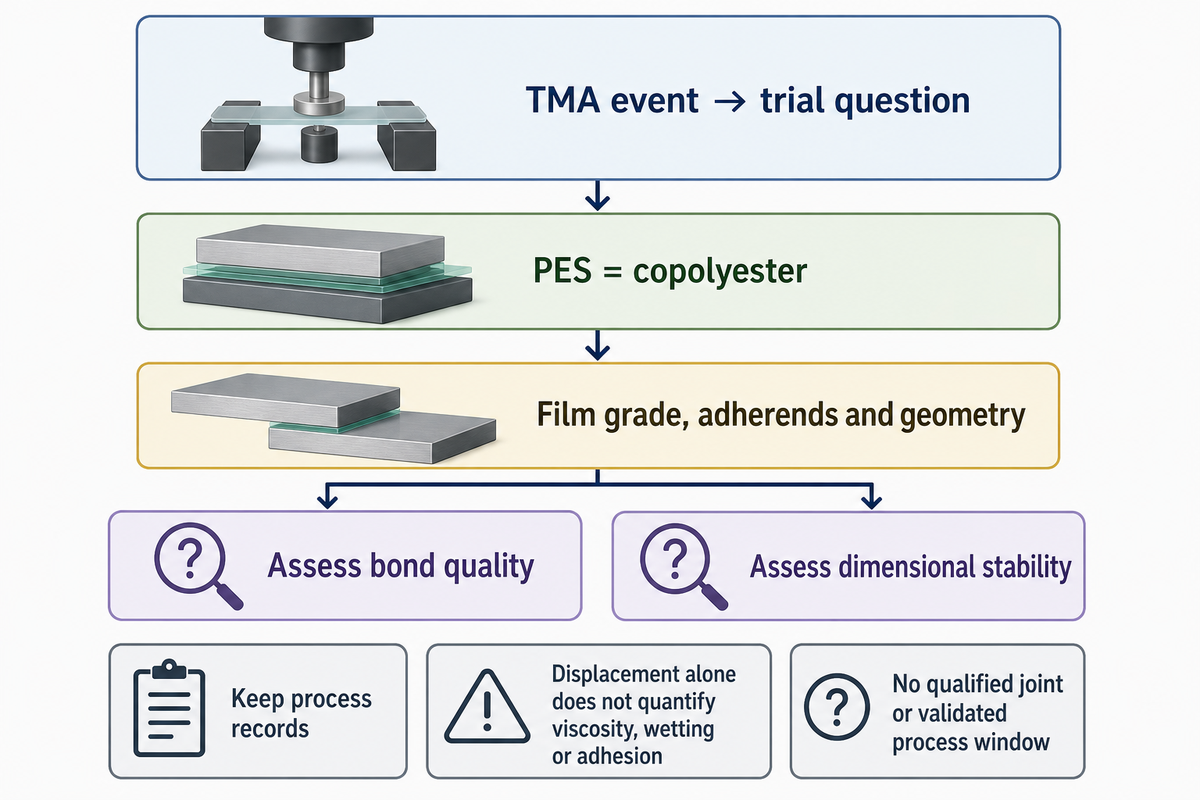
A TMA curve can identify a dimensional or loaded-softening question that’s worth considering in a bonding trial. It doesn’t provide the complete trial recipe. Chemistry, the nature of the substrate, geometry, and heat transfer determine the end result. Specify the test that you wish to perform and verify the actual bonded construction under the required process and use conditions.
A thermoplastic adhesive is heated during assembly, so load-dependent movement can be relevant in a test plan. TengYang’s PES hot melt adhesive film is described as copolyester. The material context makes a couple of dimensional and softening measurements pertinent to the questions at hand; it doesn’t provide a measured curve, a validated process window or a qualification for a given joint.
A single trace shows one dimensional response of an adhesive film, not all its fundamental characteristics. Connect the measured event to an observation that you can validate. If a film is observed to move under a load, ascertain whether the assembly that’s being joined changes thickness or moves material during the thermal cycle. A penetration onset can motivate that question, but it cannot quantify melt viscosity, wetting or adhesion from displacement alone. Keep proposed temperature conditions separate from acceptance evidence.
For a plant manager, the useful next step is a bounded trial request: identify the film grade, adherends and geometry, then agree how bond quality and dimensional stability will be assessed. In the interim, the material and process records relating to test pieces should be maintained. From a quality assurance viewpoint, procurement should request comparable scope, rather than choose the supplier who reports the highest softening temperature.
If an illustrative 0.10 mm film changes thickness under contact, the buyer is still required to have the actual laminate construction and processing record to interpret the finished bond. That thickness is an example, and not a TengYang product specification. A thermal event triggers a question; an assembly trial supplies the evidence.
Requesting comparable thermomechanical characterization reports
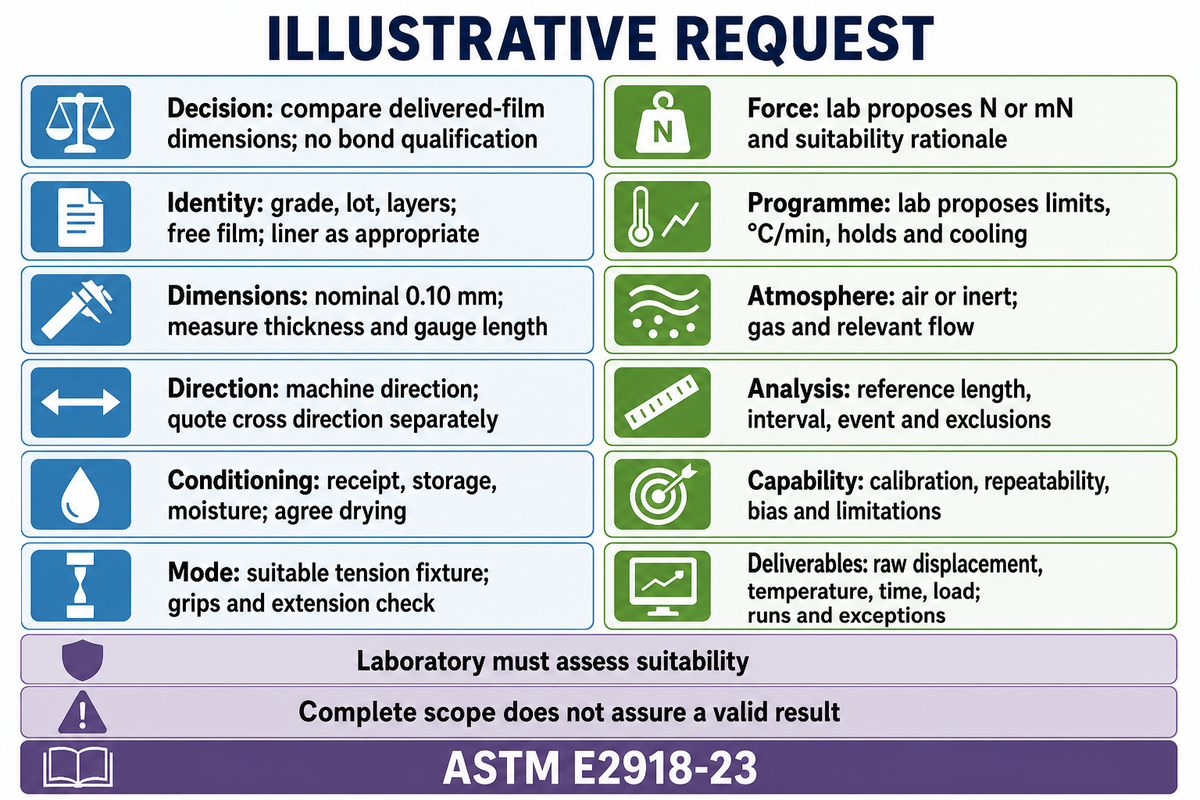
Comparable reports bring together the specimen, preparation, geometry, applied force, temperature programme and interpretation criterion. Comparable reports document calibration and measurement performance. A test request should describe the decision and specify the raw outputs required. Requesting a method acronym or a greater number of significant digits doesn’t justify that two results from different laboratories resolve a material difference.
ASTM E2113-23 discusses length-change calibration. ASTM E2918-23 focuses on performance validation including repeatability and linearity as well as bias, dimension change detection and quantitation limits. The buyer should ascertain what the laboratory demonstrates for the intended conditions. Calibration and a specimen specific result are different deliverables.
Comparable TMA Test Brief
A sample request is provided here that a buyer may use as a base. It assumes a free thermoplastic film of nominal 0.10 mm thickness, and asks for a machine direction comparison. The laboratory needs to assess if the conditions are appropriate, suggest a load and temperature programme, and explain the constraints and limitations of the method. No measured value or acceptance threshold is supplied.
| Field | Example request | Who uses the answer? |
|---|---|---|
| Decision | Compare delivered-film dimensional response; no bond qualification assumed | Plant manager |
| Identity | Record grade, lot and layers; free film, liner removed if appropriate | Quality assurance |
| Dimensions | Nominal 0.10 mm thickness; measure actual thickness and gauge length | Laboratory and quality assurance |
| Direction | Machine direction labelled; quote cross-direction run separately | Design engineer |
| Conditioning | Record receipt, storage and moisture conditioning; agree any drying | Quality assurance |
| Mode and geometry | Propose suitable tension fixture; document grips and extension check | Laboratory |
| Applied force | Lab to propose N or mN with suitability rationale | Quality assurance |
| Thermal programme | Lab to propose temperature limits, °C/min, holds and cooling | Process engineer |
| Atmosphere | State air or inert atmosphere, gas identity and flow where relevant | Laboratory |
| Analysis | State reference length, interval and event criterion; identify excluded regions | Design engineer |
| Measurement capability | Explain calibration, relevant repeatability, bias and limitations | Quality assurance |
| Deliverables | Raw displacement/temperature/time/load records, individual runs and exceptions | Procurement |
Consider that procurement receives two quotations for the same assumed film. One includes a single heating run and a summary number. The other includes conditioning records, separate axis measurements, raw data curves and an assessment of repeatability. Just comparing their totals would be comparing two different services. The buyer sends the filled briefs to both labs, and asks them to identify the included, optional and unsupported outputs. Quality assurance can then assess if the first heating question is answered, and the plant manager can see the supporting work for an assembly trial. No laboratory prices or turnaround times are assumed here. The comparison is about agreed scope, and not that the larger package is always necessary.
Keep reference methods current. As checked on 14 October 2026, ISO 11359-1:2023 supplies general principles, Part 2:2021 covers expansion and glass transition, and Part 3:2026 covers penetration temperature. A public catalogue scope helps select the relevant method; it does not replace the laboratory’s licensed procedure or prove conformity of a soft film.
For a specimen described as being 0.10 mm thick, request its actual dimensions and a loading check, prior to purchasing a temperature number. The useful data package includes information on how the movement was generated and analyzed. Repeatability needs to be included in the data package to support the intended comparison. A complete twelve field brief makes missing scope visible; a valid result still needs the lab’s calibration and repeatability data.
Key takeaway
Keep the load, probe and specimen conditions attached to every TMA curve. Use the decision map to choose the signal, then send the completed test brief to the lab before comparing material numbers.
Continue with the polymer physics knowledge hub to connect dimensional response with the wider bonding question. Identify the actual film and substrates for a copolyester trial, agree the test and assembly evidence to support your case, then make your recommendation.
Frequently Asked Questions
Which ASTM standard governs TMA CTE measurement?
ASTM E831-25 covers the technical coefficient of linear thermal expansion of solid materials using TMA. Its public scope requires enough rigidity to prevent sensing-probe indentation across the test range. A penetration or loaded-softening result should therefore not be relabelled as an E831 coefficient. Ask the lab to confirm specimen suitability, the applicable edition and the fitted interval.
What are thermo-physical properties?
Thermo-physical properties describe behavior associated with temperature and heat e.g. heat capacity, thermal conductivity and thermal expansion. They aren’t interchangeable. Expansion concerns dimensions; heat capacity concerns energy needed for a temperature change; conductivity concerns heat transport. A composite can have directional properties, while an amorphous or crystalline fraction can affect transition behavior. For a film report, name the specific property, method and temperature interval rather than request a generic set of “thermal properties.”
Is thermal analysis FEA or CFD?
Experimental thermal analysis measures a material response under controlled conditions. Finite-element analysis and computational fluid dynamics instead calculate behavior from a model and its inputs. Engineers may use measured material properties in those models, but a simulation result is not an instrument trace. Specify which task you need: laboratory characterization, structural prediction or heat and fluid flow.
When is thermomechanical analysis required?
Apply when a defined dimensional or loaded-response question requires experimental evidence. It becomes required when the applicable specification or the decision calls for that measurement, not because a supplier brochure mentions it.
How to perform thermal analysis?
Always start with the material request and select the measured response. For a TMA request, identify the specimen and its history, select the loading mode, agree the thermal programme and document the analysis criterion. The laboratory should check the material, temperature and displacement calibration, measurement performance, relevant measurement uncertainties and specimen preparation. Keep individual traces and exceptions with the result.
TMA furnaces typically heat at defined rates of 1–20°C/min, and the chosen rate belongs in the report. An increasing temperature may result in expansion, reduced stiffness or a combination of several effects. A temperature hold may allow time-dependent movement to take place. Ask the laboratory to differentiate and explain the possible responses for the supplied polymeric materials. When the desired result is heat flow, melting or oscillatory mechanical properties, an additional measurement of complementary nature should be performed rather than forcing a TMA trace to answer the question.
How this film-test guide was prepared
This TengYang bonding guide brings public thermomechanical analysis scopes and published material-characterization evidence into a probe decision map and a comparable test brief. Its force, geometry and coefficient calculations are teaching examples. The historical ABS, PVAc and filled-epoxy studies retain their own material limits. No TengYang laboratory result, product certification or validated bonding recipe is claimed.
Related Articles
- Calorimetric heat-capacity interpretation keep baselines and normalization with the measurement.
- Thermal-conductivity measurements in plastics distinguish transport from dimensional response.
- Fatigue test conditions and load histories another example of preserving the conditions behind a result.
- Reading crystallinity with its measurement limits background for polymer structure and thermal history.
References & Sources
- ISO 11359-1:2023: General principles ISO, public abstract
- ISO 11359-2:2021: Linear expansion and glass transition ISO, public abstract
- ISO 11359-3:2026: Penetration temperature ISO, public abstract and lifecycle
- ASTM E831-25: Linear thermal expansion ASTM International, public scope
- ASTM E1545-22: Glass transition under compression ASTM International, public scope
- ASTM E1824-24: Glass transition in tension ASTM International, public scope and significance
- ASTM E2113-23: Length-change calibration ASTM International, public scope
- ASTM E2918-23: Performance validation ASTM International, public scope
- Literature Review of Thermomechanical Analysis Shaun M. Matney, Los Alamos National Laboratory, 2024
- Mechanical and thermal characterization facilities Cornell University
- TMA instrument and measured outputs North Dakota State University
- Hygrothermomechanical characterization of PVAc W. G. Knauss and V. H. Kenner, Journal of Applied Physics, 1980; public abstract
- Moisture expansion of filled Hysol 9396 Luise Poley and Tim Jones, 2021 research abstract
- Detecting molded-in stress Michael Sepe, PlasticsToday, 1998; source-owned ABS case