Get in touch with Tengyang Company


The Differential scanning calorimetry heat capacity measurement requires a corrected heat flow signal, a specific specimen mass, and a controlled temperature program. Alone, a melting peak doesn’t give specific heat capacity. For the three-run sapphire comparison described here, the laboratory tests a sapphire standard, performs a blank correction, and measures the specimen. Be sure to verify exactly what the laboratory reported.
Updated October 2026
Differential scanning calorimetry heat capacity testing estimates specific heat capacity from calibrated, baseline-corrected heat flow divided by specimen mass and heating rate, or by comparison with sapphire under matched conditions.
Quick Specs
- Requested output: mass-specific cp(T), usually J/(g·K) or J/(kg·K).
- Sapphire comparison: three measurement runs, followed by data evaluation.
- ASTM E1269-24: normal public-scope range −100 to 600 °C for thermally stable solids and liquids.
- Plastics method: ISO 11357-4:2021; state the edition in the test request.
- Comparison rule: match temperature, conditioning and measurement conditions before ranking results.
What to remember: A repeatable DSC curve can still have a systematic error. Always check the empty-pan correction when interpreting sample results. Keep differential scanning calorimetry heat capacity (J/K) and specific heat capacity (J/(g·K)) measurements separate. Ask for the full temperature-dependent result and its uncertainty, rather than a single, unexplained value.
Define Specific Heat Capacity Before the DSC Test
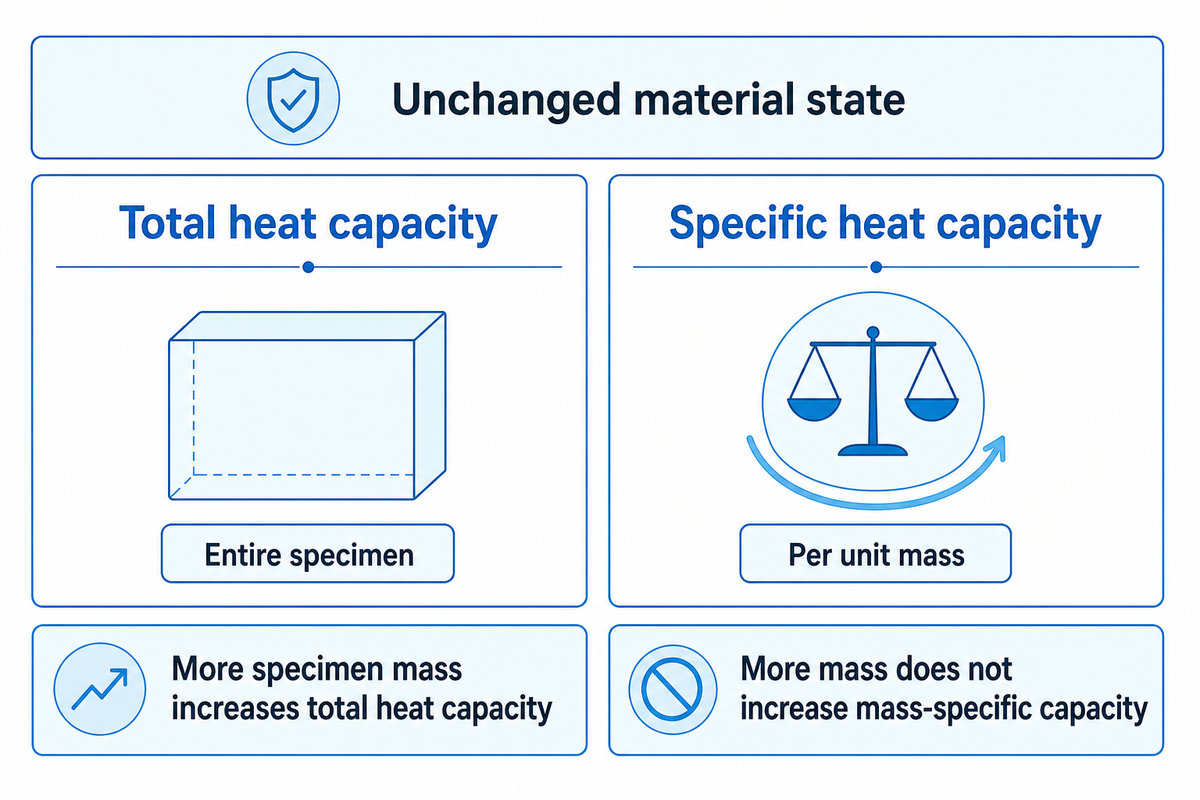
Specific heat capacity defines the amount of heat needed per unit mass for a temperature increase, under stated conditions. The DSC analysis commonly reports this as a function of temperature. Total heat capacity belongs to the entire specimen. It’s important to distinguish sample masses and units when reporting results.
For an unchanged material state, write total heat capacity as Cp = m cp. A specimen with cp = 1.20 J/(g·K), and a mass of 0.0100 g has Cp = 0.0120 J/K. Both values describe the same specimen, but answer different questions. Increasing the specimen mass, also increases total heat capacity. However, increasing specimen mass doesn’t increase mass-specific capacity, cp.
A differential scanning calorimeter is used to measure the heat flow rate difference between a sample and a reference under a temperature program. The response is measured as a function of temperature or time. Heat-flux DSC uses a sensor arrangement to relate a temperature difference to heat flow. Differential thermal analysis, or DTA, records a temperature difference between the sample and the reference material. DTA and DSC signals require their own instrument models and calibration; a plotted temperature difference isn’t automatically a quantitative measurement of heat flow.
The temperature controlled furnace supplies temperature changes, while the sensor and pan geometry affect the recorded response. Temperature control and thermal contact both matter: the indicated temperature of the sample can differ from temperatures within the sample during rapid scanning. Check the sample and reference material labels in the instrument record. Reliable DSC interpretation requires both heat flow and temperature information and a clear definition of the thermal properties being calculated.
Common mistake: Comparing heat capacities from two reports without checking mass normalization. Is J/K, J/(g·K), or J/(kg·K) meant by “Cp”? Conversion of units is possible, but comparison across different material states requires more information. The broader polymer physics for bonding guide positions this thermal property relative to the other influences on bonded assemblies.
1 J/(g·K) is equivalent to 1,000 J/(kg·K) and 1 mW is equal to 0.001 J/s. Units can be converted, but this doesn’t correct differences in temperature and conditioning programs. The mass normalized comparison behind this distinction is described in the University of Utah sapphire-method guide.
DSC Baseline Correction: Match Three Measurement Runs
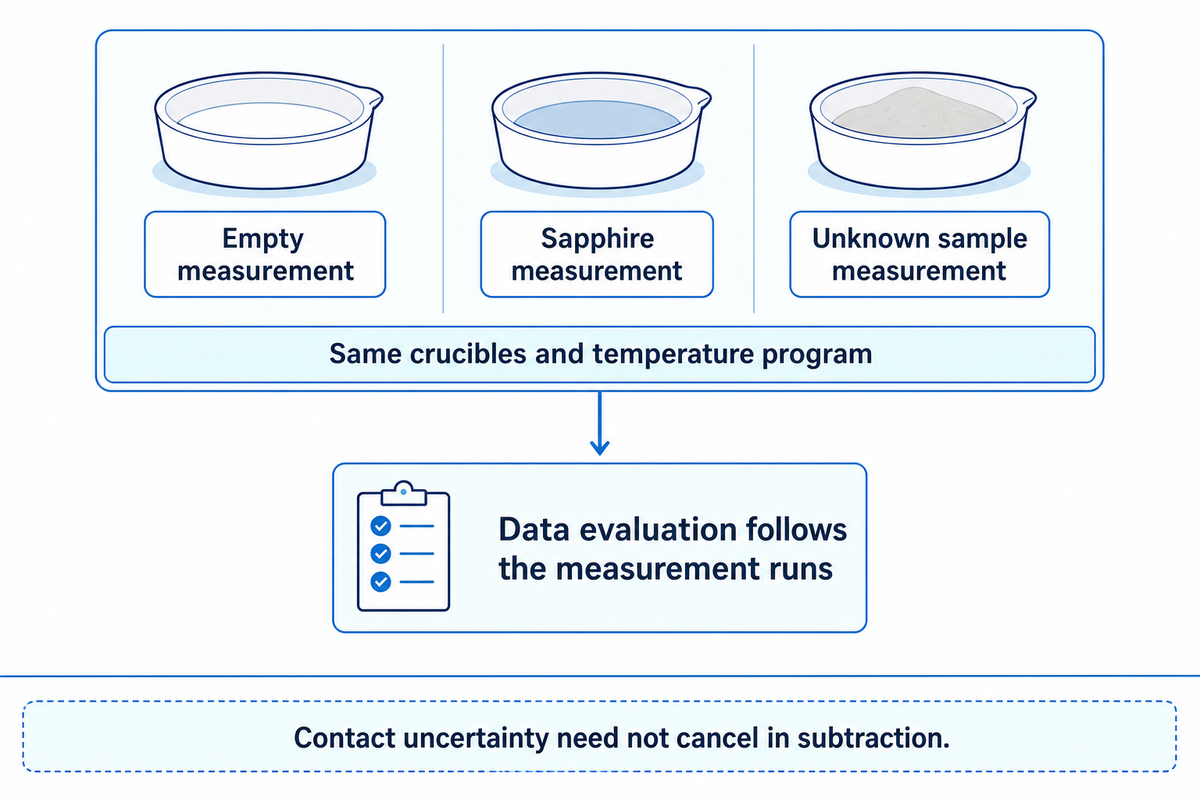
DSC baseline correction removes the empty-pan signal. The three-run method requires an empty measurement, a sapphire measurement, and a measurement of the unknown sample under matched conditions. Residual effects of differences in pans, placement and temperature programs may not be fully subtracted out and can lead to erroneous specific heat capacity conclusions.
The University of Utah procedure outlines use of the same crucibles and temperature program for successive scans. “Three runs” means three measurement types. It doesn’t mean heating the unknown specimen three times. The four procedural steps can include data evaluation after the three measurement runs.
3-Run DSC Record: compare the setup before the curve
Refer to the record below for comparison of the set-up fields. This editorial checklist integrates the university procedure with the contact problem examined by Rharbi and Hugenell, and isn’t an additional test standard. The record helps a quality team to identify a mismatch before requesting a laboratory to explain a disputed Cp curve.
| Recorded field | Empty / sapphire / specimen comparison | Decision | Limitations / Not suitable for |
|---|---|---|---|
| Pan material | Record material for all three runs | Investigate a change before subtraction | Different pan responses remain a concern |
| Pan identity and mass | Record pan pair and relevant masses | Use the method’s matching procedure | Nominally identical pans may differ |
| Lid and sealing | State open, covered or sealed condition | Keep the intended boundary consistent | Sealing can change evaporation and pressure |
| Reference-side pan | Identify the reference-side setup | Check that the blank represents it | Reference-pan changes affect the difference signal |
| Material mass | Record sapphire and specimen masses in mg | Use their actual masses in the calculation | A wrong mass changes normalization |
| Scan rate | Record K/min for each measurement | Match the temperature program | Different rates can change thermal lag |
| Temperature interval | Record start, end and evaluated interval in °C | Compare Cp at the same temperatures | Transition regions need separate interpretation |
| Equilibration holds | Record hold temperatures and durations | Compare the programmed starting condition | An unstable baseline is not cured by labeling a hold |
| Purge conditions | Record gas and flow in mL/min | Explain any change between runs | Gas heat transfer can alter the response |
| Placement and contact | Document seating and specimen geometry | Investigate poor thermal contact | Contact uncertainty need not cancel in subtraction |
Illustrative comparison: A quality engineer receives two Cp curves for the same film lot. Both labs show a 10 K/min scan but differ on the type of pan used, one being open and the other being sealed. The engineer evaluates conditioning and whether the film can lose volatile material. Next, the laboratory provides the empty pan curve and sapphire runs for each specimen. A difference in the condition of the lid still makes a difference, even if the resulting curves appear smooth. The next best thing to do is achieve agreement of a common test condition, followed by a documented repeat if needed. Determining that the lower of the two curves is the “better” film would make a judgment in purchasing based on an unresolved measurement difference.
Looking at pan contact, in their 2026 heat-capacity study, Yahya Rharbi and Frédéric Hugenell describe a systematic effect of contact between pan and sensor whose uncertainty remains after ordinary blank comparison.
“its associated uncertainty does not cancel out.”
At 10 K/min, the runs must still use the same pan and be programmed in the same manner. A smooth blank is a requirement. Pan-sensor contact can still differ between the empty-pan, sapphire and specimen runs. The method established by the university determines the matched comparison, and the 2026 contact study describes the reason for the remaining uncertainty.
ASTM E1269 and Sapphire Calibration
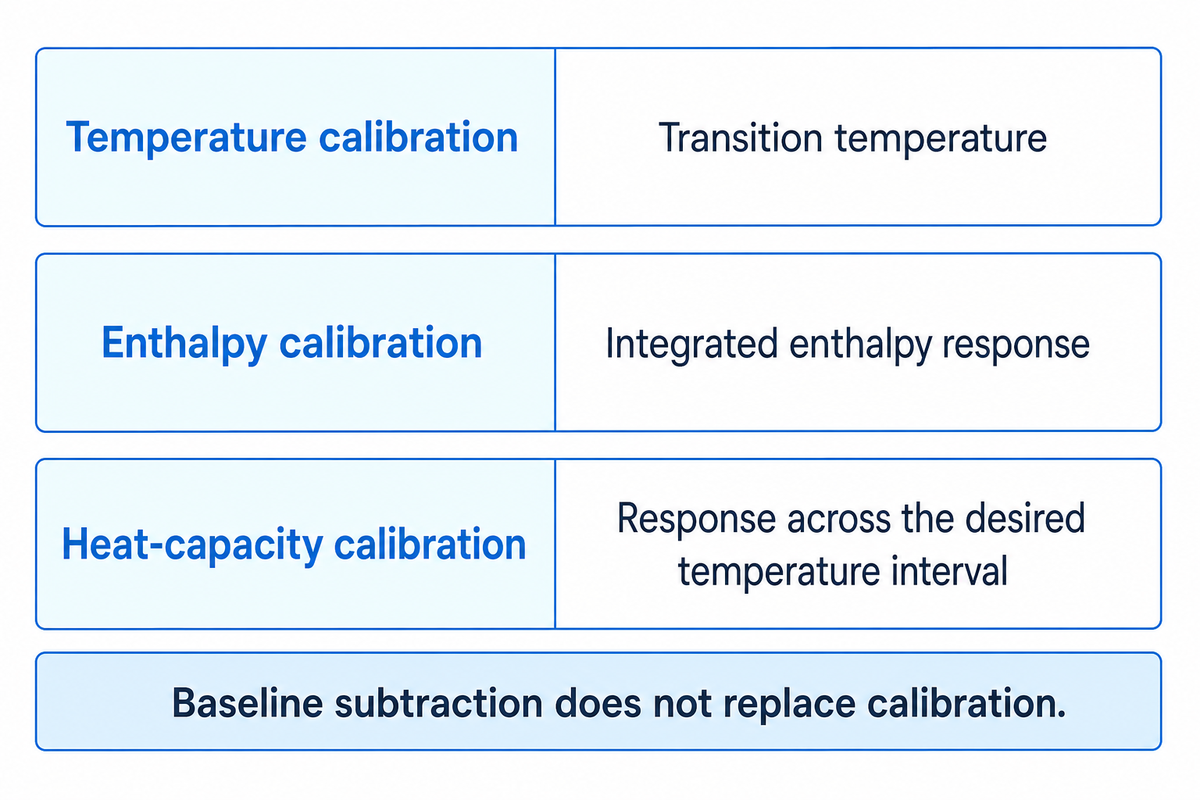
ASTM E1269 addresses specific heat capacity by differential scanning calorimetry; sapphire offers a known reference response for comparison. Temperature calibration, enthalpy calibration, and heat-capacity calibration address different queries. A laboratory should be able to distinguish the procedure and reference data used, rather than accepting one melting-standard check as proving everything in the DSC analysis.
The ASTM E1269-24 public scope covers thermally stable solids and liquids over a normal range of -100 to 600 °C. Extension of the range depends on the instrument and sample holder. The stated range is a scope statement, not a permission to scan every polymer to 600 °C. First establish thermal stability and appropriate pan conditions for the specimen.
For plastics, ISO 11357-4:2021 specifies determination of specific heat capacity. The earlier 2014 edition is withdrawn. The catalog’s 2026 systematic-review dates mark the routine review ISO runs every 5 years, not a new edition. If a quotation cites an ISO or DIN adoption, request its exact identifier and edition; the catalog pages do not provide the full paid procedure or establish equivalence between every adoption.
Should a melting standard be enough?
A melting standard can check a transition temperature or integrated enthalpy response under its calibration procedure. Determining specific heat capacity requires the appropriate heat-capacity response across the desired temperature interval. The specific heat capacity of sapphire varies with temperature; the laboratory should employ an appropriate reference value for each temperature measured.
The 2023 Heat–Cool method paper states that a corrected heat-flow calculation may still require a heat-capacity calibration factor. Heat transfer between the pans, cells and purge environment affects the response. Accurate specific heat capacity determination needs this calibration addressed. Baseline subtraction and calibration address related issues, but one doesn’t eliminate the other.
Common mistake: A common mistake is to determine whether the calorimeter is “calibrated” and stop there. Request the calibration quantity, date, reference material and applicable temperature range. If the buyer is requesting a comparison within an operating temperature range, ask how the check supports that range. A certificate for a different quantity doesn’t satisfy the request.
ASTM’s −100 to 600 °C normal scope concerns thermally stable specimens, and it allows extension only with suitable instrumentation and holders. A Cp report should state the actual evaluated interval. A report covers only the temperatures the laboratory measured, not the method’s full normal scope.
DSC Calculation: Heat Flow, Mass and Heating Rate
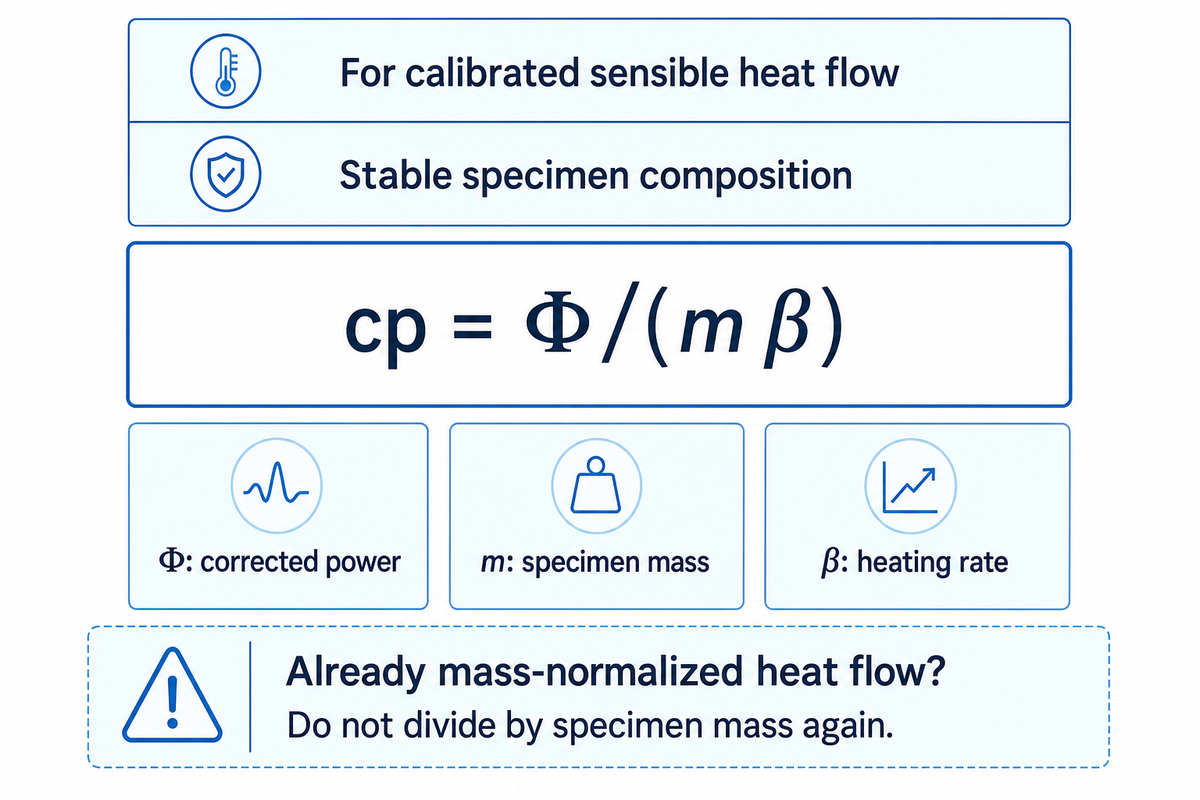
A DSC heat-capacity calculation incorporates a corrected heat flow, mass and scan rate, or compares the corrected specimen signal to sapphire. In both cases, use signals at the same temperature. The expression power over rate provides a sensible heat model under its assumptions; thermal events or changing specimen mass require additional interpretation.
What is the heat flow unit used in DSC?
DSC heat flow is typically reported in mW. A trace may use mW/mg or W/g instead. Look at the axis before applying a mass correction. Dividing an already mass-normalized heat-flow signal by specimen mass again defines a new quantity and gives a wrong specific heat capacity.
For calibrated sensible heat flow, cp = Φ/(m β), where Φ is power corrected in J/s, m is mass in g and β is heating rate in K/s. A change of temperature of 1 K has the same increment as 1 °C. Convert 10 K/min to 10/60 = 0.166667 K/s before substituting a power value in watts. Substitute the value of power (Φ) in watts in the above equation.
How to calculate heat capacity from DSC?
Start with the baseline-corrected, calibrated signal of the laboratory. Use the actual mass and heating rate. For sapphire comparison, use cp,s = (ΔΦs/ΔΦr)(mr/ms)cp,r. Each ΔΦ is a difference in heat flow from the blank at the same temperature. The reference Cp value has to be at the same temperature for the calculation of specific heat capacity of the sample.
Illustrative worked example: A process engineer is reviewing a calculation outside the transition region. The calibrated corrected signal is 2.00 mW, the specimen mass is 10.0 mg and the scan rate is 10 K/min. Convert the inputs to 0.00200 J/s, 0.0100 g and 0.166667 K/s. Entering the values gives a result of 0.00200/(0.0100 × 0.166667) = 1.20 J/(g K). The engineer then reviews the software export: if the trace reads W/g, the mass division has already been done. The result is an arithmetic example, not a suggested value for any adhesive. The acceptance of the result depends on valid calibration, stable specimen composition and proper baseline treatment at the temperature of interest.
A separate illustrative calculation of sapphire uses ΔΦs = 2.40 mW, ΔΦr = 2.00 mW, mr = 0.0200 g and ms = 0.0100 g. Assuming a reference value of 0.800 J/(g K) at that temperature, the result is (2.40/2.00) × (0.0200/0.0100) × 0.800 = 1.92 J/(g K). A NIST-accepted literature value for sapphire is 0.7749 J/(g·K) at 25.0 °C; use the tabulated value at each measured temperature.
Common mistake: Using the simple expression through evaporation, degradation or some other changing-composition event. A 2025 theoretical DSC study describes how changing mass and composition can affect recorded thermal signals. The modeled desorption cases aren’t film test results. Check thermal stability and possible volatile loss prior to treating the complete signal as sensible heat.
A 2.00 mW corrected signal at 10 K/min gives a value of 1.20 J/(g·K) for the illustrated 10.0 mg sample. This calculation requires a calibrated signal and stable mass. A trace labeled mW/mg already includes mass normalization. Another division by 10.0 mg would increase error rather than improve precision.
DSC Curve Interpretation at Polymer Transitions
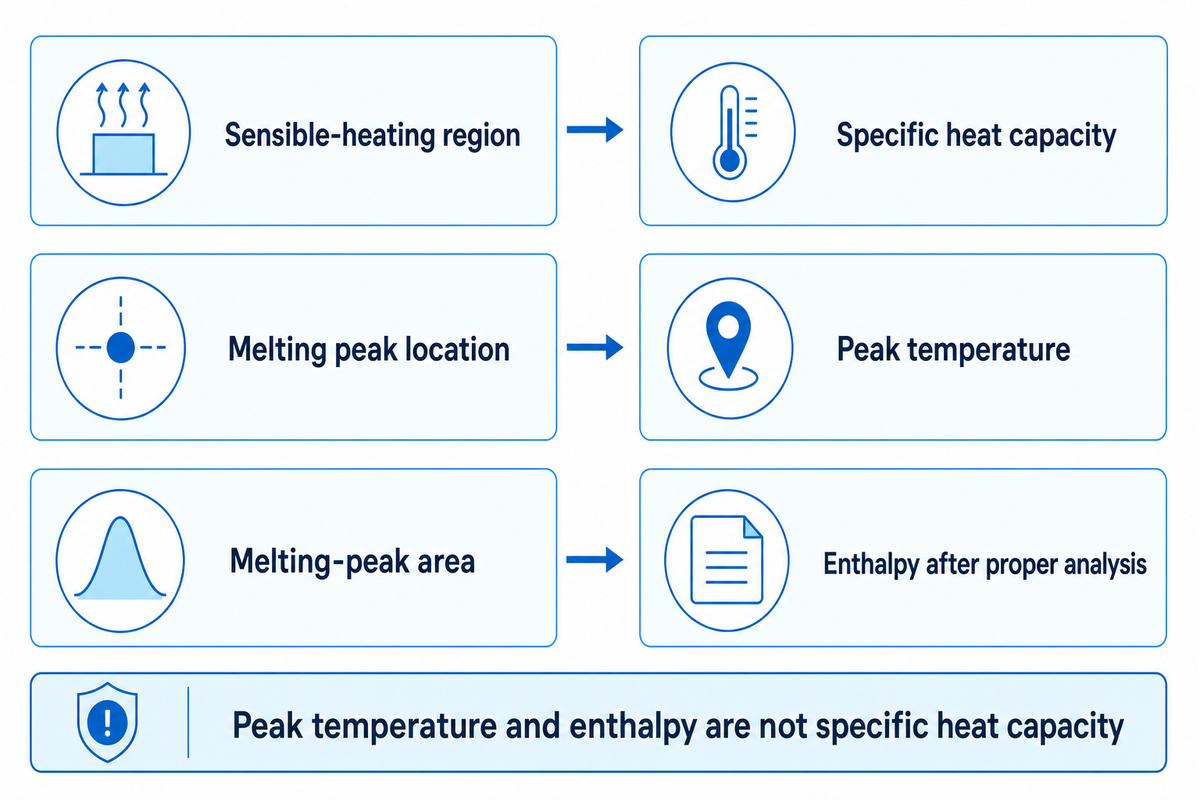
Sensible heating provides the baseline flow used in Cp calculations; polymer transitions can show steps (glass transition) or peaks (melting and crystallization). It’s better to evaluate separate intervals for Cp and thermal events, and report the transition metric rather than summing features.
The heat flow signal captures endothermic and exothermic behavior under the selected sign convention. DSC measures contributions from sensible heating, as well as transitions like melting and crystallization and chemical reactions. An area associated with a transition yields enthalpy in J/g after proper analysis; the location of a peak provides a temperature. Neither has the units of specific heat capacity.
A 2024 paraffin study measured enthalpy using DSC and determined the specific heat capacity using laser flash analysis. Making that distinction is key when interpreting research papers. A table including both properties doesn’t mean the authors were able to determine both with DSC.
Use the signal-type matrix to keep the quantities separate. It provides classification for report fields and interpretation problems, not polymer grades. The links on glass transition and melting and interpreting polymer crystallinity cover those decisions in more detail.
| Signal type / Category | Reported quantity | Interpretation check | Limitations / Not suitable for |
|---|---|---|---|
| Sensible-heating region | cp(T), J/(g·K) | Verify calibrated baseline and stable state | Do not include unresolved event heat |
| Whole specimen | Cp, J/K | Check actual mass | Not directly comparable across masses |
| Raw heat flow | Power, mW | Check blank and calibration | Not Cp without further calculation |
| Normalized heat flow | Power per mass, W/g | Check software normalization | Do not divide by mass twice |
| Glass-transition step | Defined Tg metric, °C | State onset, midpoint or other convention | Not a melting enthalpy |
| Melting peak location | Peak temperature, °C | State scan and thermal history | Not interchangeable with onset |
| Melting-peak area | Enthalpy, J/g | State integration baseline and limits | Not a Cp value in J/(g·K) |
| Crystallization event | Temperature and enthalpy | Record heating or cooling context | Different histories can change behavior |
| Variable-mass event | Mixed thermal response | Investigate evaporation or decomposition | Stable-mass Cp assumptions may fail |
| Modulated response | Defined Cp component | State period, amplitude and analysis | Different time scales need qualification |
Common mistake: It’s a common mistake to use a melting temperature as the complete bonding-process setting. Heat transfer through the assembly, pressure and dwell time remain separate process questions. A report on EVA hot melt adhesive film should identify the actual grade and tested condition. The product category alone doesn’t define a Cp value or DSC behavior.
Temperature-Modulated DSC: When Comparison Helps
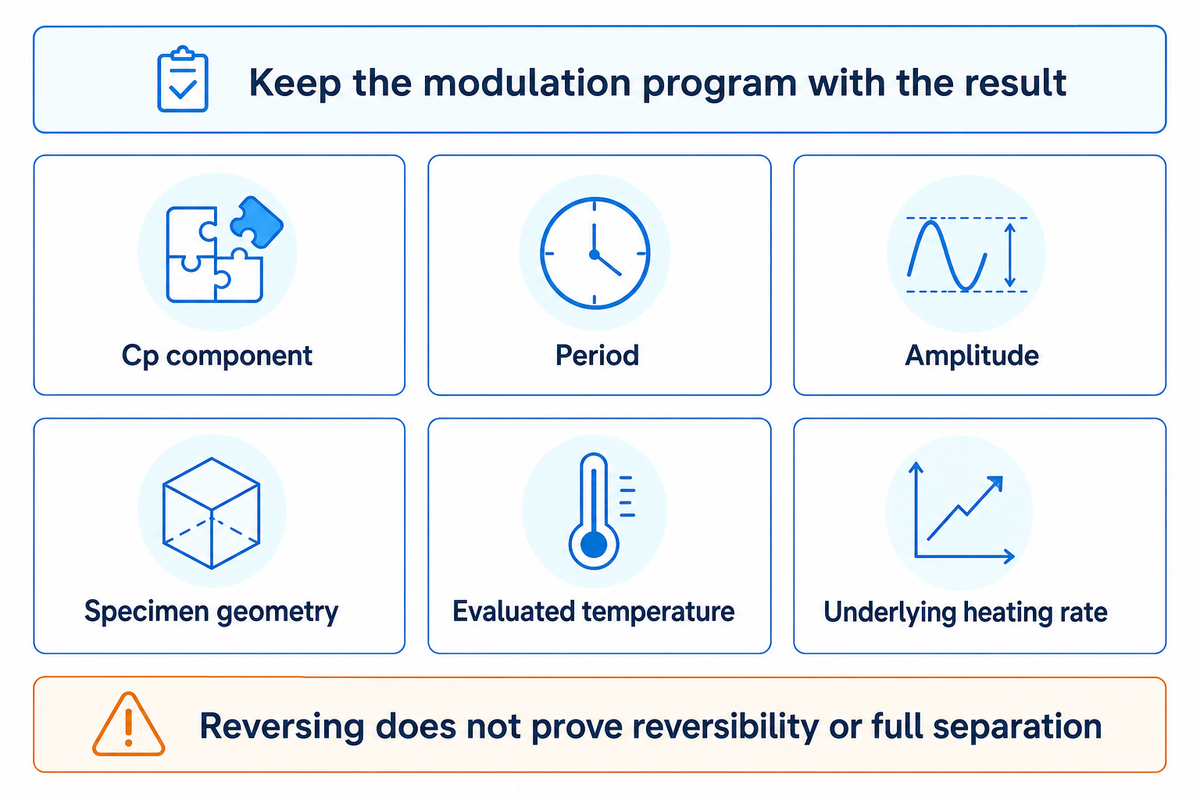
Temperature-modulated DSC modulates the underlying temperature program and analyzes the response. The heat-capacity component is defined by the modulation method and time scale. Overlapping behavior can be studied using modulation; however, a reversing signal shouldn’t be interpreted as conclusive proof that the thermal process is reversible or fully separated.
The modulation frequency, amplitude and specimen geometry, along with heating rate, are identified in the public abstract of Krishnan and Nagarajan’s 2010 evaluation. These dependencies are applicable when comparing data from modulated differential scanning calorimetry. It’s more valuable to describe the conditions used to modulate the program than to compare traces based solely on the brand of the instrument used.
In a 2013 pharmaceutical crystal/glass study, the authors reported practical conditions near 10 mg, including a 60 s period at 2 °C/min and a 90 s period at 1 °C/min. Those are study-specific conditions for prepared crystalline and glassy specimens, not a film-testing recipe. They illustrate why a Cp result needs the modulation program attached.
Common mistake: equating “reversing” to something equivalent to equilibrium or reversible behavior. The Garden, Richard and Saruyama author abstract discusses frequency-dependent complex heat capacity in modulated measurements. Ask which element is being reported and if the time scale of the selected measurement accounts for the comparison that’s desired. A dynamic response and an ordinary scan may denote diverse measurement conditions.
In the field of pharmaceutics, published works have employed 60 second and 90 second modulation periods with variable underlying scan rates. Those instances illustrate the data that should be kept in a report, not default settings for adhesive films. The buyer comparing modulated results needs the Cp component, the period, the amplitude, and the geometry of the specimen as well as the temperature at which the values were determined.
DSC Measurement Uncertainty and Repeatability
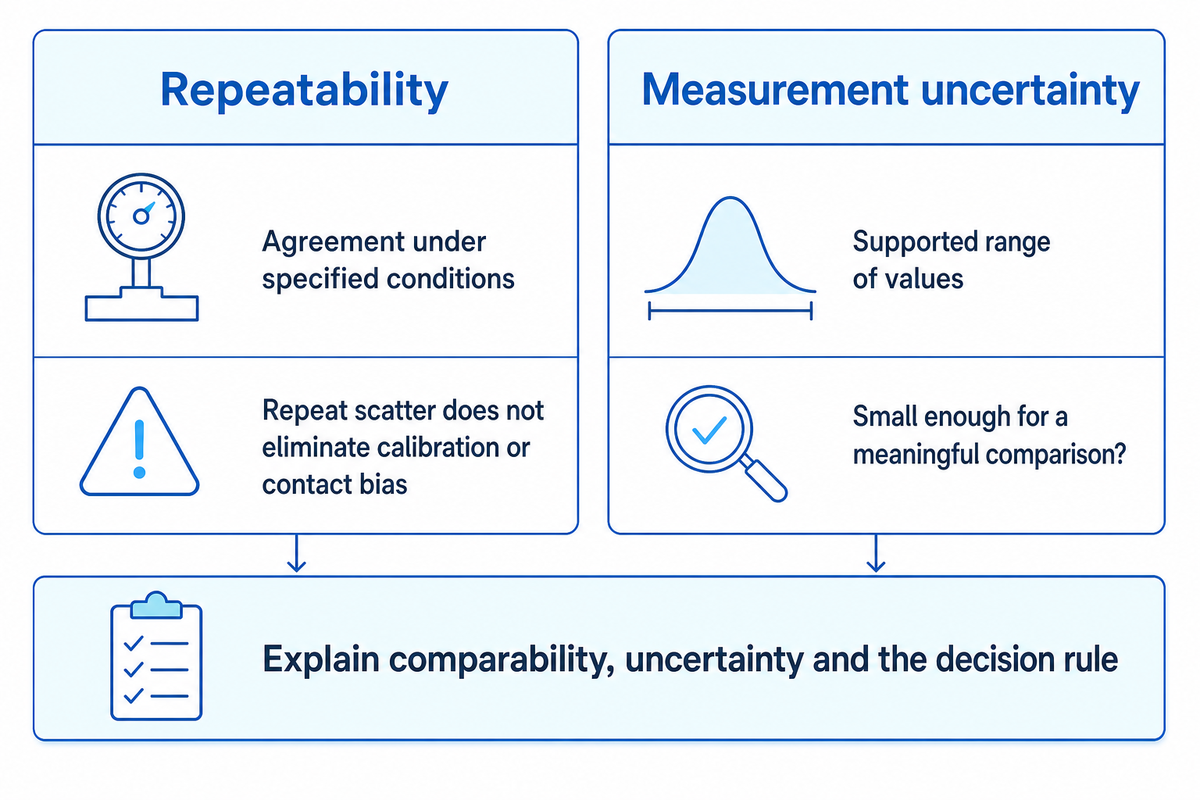
Repeatability of DSC measurements signifies agreement of repeated results under specified conditions, not accuracy. Measurement uncertainty defines the range of values in which the result is supported. Repeat scatter doesn’t eliminate calibration or contact bias. State the metric, method of calculation and limits of the measurement prior to specifying a percentage to validate a material comparison.
The 2023 Heat–Cool study discusses literature deviations around ±2–5% for existing procedures and replicate standard deviations around ±1–2% for its Heat–Cool measurements. The first is deviation from literature values and the second is repeat scatter, so a report quoting a percentage should name which one it means.
Even the most careful publications can have scope that’s too narrow. A 2026 molten-salt study assessed sealed gold crucibles and salt specimens at elevated temperatures. The study reported uncertainties that excluded uncertainty contributions from the sapphire and gold reference data. Those results shouldn’t be considered as claimed uncertainties for a polymer film test.
NIST’s metrological-traceability guidance states that a calibrated instrument and a traceable measurement result aren’t the same. Traceability doesn’t, of itself, demonstrate fitness for purpose. The buyer must assess whether the uncertainty is small enough for the comparison to be meaningful; a calibration certificate doesn’t make this determination.
Illustrative purchasing decision: A buyer wishes to differentiate two formulations at a given temperature. The reported values are 1.20 and 1.23 J/(g·K), a difference of 0.03 J/(g·K). Each report includes an expanded uncertainty of 0.05 J/(g·K), and the buyer will check the coverage factor and conditions. The buyer won’t call the second formulation superior based on the values reported and the expanded uncertainties reported alone. Before the test results influence an order, the laboratory should explain comparability, uncertainty and the decision rule. The plant manager will then evaluate if it’s necessary to perform another test to answer a useful process question. Buying more decimal places on the report won’t make the process difference or comparability more clear.
What are the limitations of differential scanning calorimetry?
There are limitations to DSC. These can include thermal lag, poor contact, and baseline instability and overlapping thermal events. Interpreting results can be complicated due to varying sample geometry and mass, heating rate, and changing sample composition. For Cp results, the interpretation can also vary due to choice of analysis. The useful limit is the supported measurement under stated conditions, rather than a generally accepted accuracy for the instrument.
When not to accept a Cp comparison: pause a material ranking when the reports use different sample states, unknown normalizations or incomparable evaluation intervals. A repeatable result with an undefined baseline is unresolved. Variable pan-sensor contact after reseating can cause a systematic contribution that ordinary blank subtraction may not eliminate, as explained in the 2026 contact study. Higher heating rates can change temperature shifts through thermal lag; increasing the scan rate isn’t a universal solution to weak signals or low heat capacity. An older high-temperature platinum study investigates rate and mass effects in their apparatus, therefore, their settings should be aligned within that experimental scope. Likewise, a fitted Cp value during mass loss should also be modeled and qualified explicitly. Request an explanation or comparable repeat from the laboratory before considering results as acceptance evidence. Retain the original data to help the next reviewer refer to the same baseline.
Common mistake: requesting “the most accurate DSC test” without defining what difference matters. A 0.03 J/(g·K) illustrative separation calls for a different resolution discussion than a broad thermal characterization screen. State the difference that matters and compare it with the laboratory’s expanded uncertainty; a 0.03 J/(g·K) gap sits inside a 0.05 J/(g·K) uncertainty.
Order a DSC Test With a Report You Can Compare
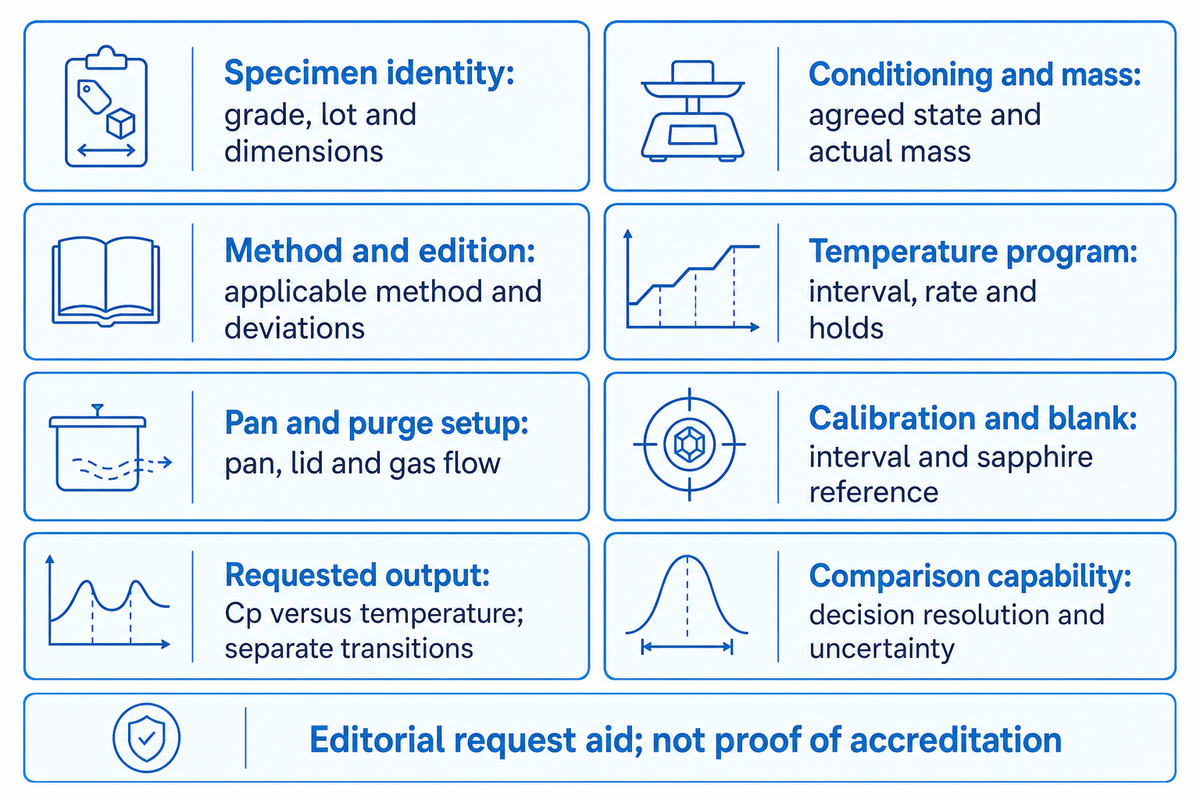
An equivalent DSC report describes the sample condition and test method, temperature program, pan conditions, calibration and quantity. It provides an explanation of repeatability and uncertainty when relevant to the difference that matters. Agree on these before performing DSC so that the resulting thermal analysis addresses a material difference.
8-Field Cp Report Check: agree the request
The report check is an editorial form for a laboratory request based on the issues of method and traceability discussed previously. Complete the fields in a lab enquiry and provide your material and decision requirements. It is neither an ASTM nor an ISO conformity score, and none of the suggested fields establishes laboratory accreditation.
8-Field Cp Report Check — copy these into your quote request:
| Parameter | Recommended range | Why it matters | How to verify |
|---|---|---|---|
| Specimen identity | Actual grade, lot and specimen dimensions in mm | Connects result to the tested material | Sample label and report identifier |
| Conditioning and mass | Agreed state; actual mass in mg | Moisture and mass affect interpretation | Preparation record and weighing data |
| Method and edition | Applicable ASTM / ISO method and edition | Defines the requested measurement | Method identifier and any deviations |
| Temperature program | Project interval in °C; rate in K/min; holds in min | Makes thermal history comparable | Program export and evaluated interval |
| Pan and purge setup | Agreed pan/lid; gas flow in mL/min | Sets contact and atmosphere conditions | Setup record for blank and material runs |
| Calibration and blank | Relevant interval in °C; sapphire reference source | Supports corrected Cp response | Associated correction and reference records |
| Requested output | cp(T) in J/(g·K); separately labeled transitions | Avoids mixing power, enthalpy and Cp | Axis labels, data table and calculation method |
| Comparison capability | Decision resolution and uncertainty in J/(g·K) | Tests whether the result answers the buyer’s question | Replicates, uncertainty basis and decision rule |
For DSC experiments intended to compare two lots, request the original DSC data and a table at agreed temperatures. Indicate how the sample is measured, including heating or cooling direction, isothermal holds at the selected constant temperature, and any treatment prior to the scan. A constant heating rate and a constant temperature segment answer different questions; the report should identify which calculation used each segment.
Common mistake: A common mistake is thinking a comparison of thermal properties proves bond performance. While a comparison of thermal properties can be useful in a heat transfer discussion, it doesn’t validate bond performance in peel tests, durability, or the complete assembly’s melting and crystallization behavior. In this case, the test request is tied to the actual assembly question. Access the site’s tools to compare bond report fields and construct a bond report request. Keep requests tied to the actual question. The site tools don’t assess the validity of science and don’t send the request.
Key takeaway
A three-run sapphire comparison needs a matched blank, reference and specimen program. Accept the resulting Cp curve only with units, material state and uncertainty appropriate to the decision.
If a report doesn’t provide all the information needed to reach a comparison, provide the laboratory the missing information as well as the temperature range that pertains to your project. Keep the report with the material specification and process records. Use the polymer physics hub to translate thermal property evidence to broader bonding discussions.
Frequently Asked Questions
What is the peak temperature in DSC?
The DSC peak temperature is the temperature at the maximum of a particular heat-flow peak.
Peak position depends on the thermal event and test conditions, including heating rate and thermal history. State the sign convention, event and analysis method when reporting it. Melting onset and melting peak are separate metrics and should be labeled separately. A peak temperature is expressed in °C or K; it does not supply a specific heat capacity in J/(g·K).
Can DSC measure melting point?
Yes; DSC reports melting as an onset or peak temperature under a defined measurement and analysis procedure.
The reported value may be an onset temperature or a peak temperature, depending on the method and purpose. Polymers and mixtures may melt across an interval rather than at one sharp temperature. Include the scan rate and thermal history with the result. A laboratory’s melting-temperature result should not be substituted directly for a complete bonding-process temperature setting.
What is the difference between heat capacity and specific heat capacity?
Heat capacity applies to the whole specimen; specific heat capacity is normalized by mass.
Total heat capacity commonly uses J/K, while mass-specific heat capacity uses J/(g·K) or J/(kg·K). Multiply the mass-specific value by the specimen mass in matching units to obtain the total. Reports sometimes use “Cp” loosely, so read the units and normalization. Values from specimens of different masses cannot be compared until the reported quantity is clear.
Is CV specific heat capacity?
CV denotes heat capacity at constant volume; cv commonly denotes its mass-specific form.
Check the notation and units. Conventional DSC reports commonly discuss Cp. Constant-volume and constant-pressure heat capacities describe different constraints; justify any interchange.
Should I calibrate the DSC with new samples?
Not automatically; a new specimen can run on the laboratory’s validated calibration when it covers the quantity, temperature interval, pans and method.
Check whether the existing calibration covers the quantity, temperature interval, pan arrangement and method being used. Changes in setup or questionable verification results may require further checks. For a sapphire comparison, retain the associated blank and reference measurements and document any departure from the method before using the result to compare materials.
References & Sources
- University of Utah, Heat Capacity: Sapphire Method public laboratory procedure.
- ASTM E1269-24, Standard Test Method for Determining Specific Heat Capacity by Differential Scanning Calorimetry public catalog scope.
- ISO 11357-4:2021, Plastics, Differential scanning calorimetry, Part 4: Determination of specific heat capacity public catalog.
- Wada, Baldwin and Van Hecke, 2023 Heat–Cool DSC heat-capacity study published experimental comparison.
- Rharbi and Hugenell, 2026 heat-capacity measurement study pan-contact effects; publication volume dated January 2026.
- Gao and colleagues, 2024 paraffin phase-transition study DSC transition measurements distinguished from laser-flash Cp.
- Krishnan and Nagarajan, Evaluation of heat capacity measurements by temperature-modulated differential scanning calorimetry, 2010 public abstract.
- Harada and colleagues, Practical Approach for Measuring Heat Capacity of Pharmaceutical Crystals/Glasses by Modulated-Temperature Differential Scanning Calorimetry, 2013 public abstract.
- Exothermic contributions in the DSC signal of endothermic effects, 2025 variable-mass theoretical analysis.
- Garden, Richard and Saruyama, Entropy production in temperature modulated differential scanning calorimetry, 2008 public author abstract.
- Gardner and colleagues, 2026 molten-salt heat-capacity study uncertainty with stated exclusions.
- Jacob and Schlesinger, Evaluation of the Accuracy and Reproducibility of a High-Temperature Differential Scanning Calorimeter by Heat Capacity Measurements practitioner article with university authors and disclosed equipment support.
- NIST, Metrological Traceability: Frequently Asked Questions and NIST Policy measurement-result traceability and fitness for purpose.
Publication note: This guide integrates public laboratory guidance and references the catalogs of research and academic publishers. Illustrative examples of computations and case studies are provided. DSC test results of clients, laboratory accreditations, product-specific heat capacity, and other non-public data aren’t included. Catalog entries were assessed; paid standard clauses weren’t reproduced.