Get in touch with Tengyang Company


Updated October 2026
Raman spectroscopy detects chemical features in polymers by measuring the scattered light at different energies from the incident laser. Useful film spectra contain peaks at energies that pertain to the features of the layer of interest. The signal must endure the measurement, and a suitable reference is required.
Raman spectroscopy measures energy shifts in scattered light to reveal molecular vibrations. Polymer-film interpretation requires separating Raman bands from fluorescence and support signals, then checking the pattern against a suitable reference.
Key points for film samples
- A longer laser wavelength can improve a polymer spectrum while making its glass support background worse.
- Baseline correction changes the trace; useful diagnostic bands and a reliable assignment still need checking.
- A confocal depth profile can mix layers. A small scan step is different from verified depth resolution.
- Infrared spectroscopy answers complementary chemical questions; thermal and adhesion tests address separate properties.
Reading essentials
Horizontal axis: Raman shift in cm−1. Vertical axis: measured or processed intensity. Record the excitation wavelength in nm separately. Start with the raw spectrum, support blank, target-layer description and reference identity.
Fundamentals of Raman Spectroscopy
Raman spectroscopy is based on energy changes in a small fraction of light scattered from a polymer. The Raman effect produces bands whose positions and shapes help distinguish chemical structures. The spectroscopy technique uses the bands as analytical fingerprints, and sampling conditions influence which part of the film generates the measured spectral pattern.
What is Raman spectroscopy used for?
Raman spectroscopy can be used for chemical analysis, investigating molecular structure and mapping differences across a sample. Immediate tasks include an unknown comparison to a reference, identification of various components, and analysis of selected bands. Researchers also use Raman spectroscopy to study orientation or crystallinity. Such a Raman spectroscopic study needs a method that connects the measured features to that particular structural quantity.
For a purchasing or quality team, the first distinction is between material identity and functional performance. A spectrum compatible with a polymer family answers a chemistry question. Adhesion, dimensional stability, fatigue, and heat transport are examples of performance characteristics evaluated in separate tests. A film may have the right chemistry and still perform poorly due to layer construction, or the method used to join the layers.
How does Raman spectroscopy work?
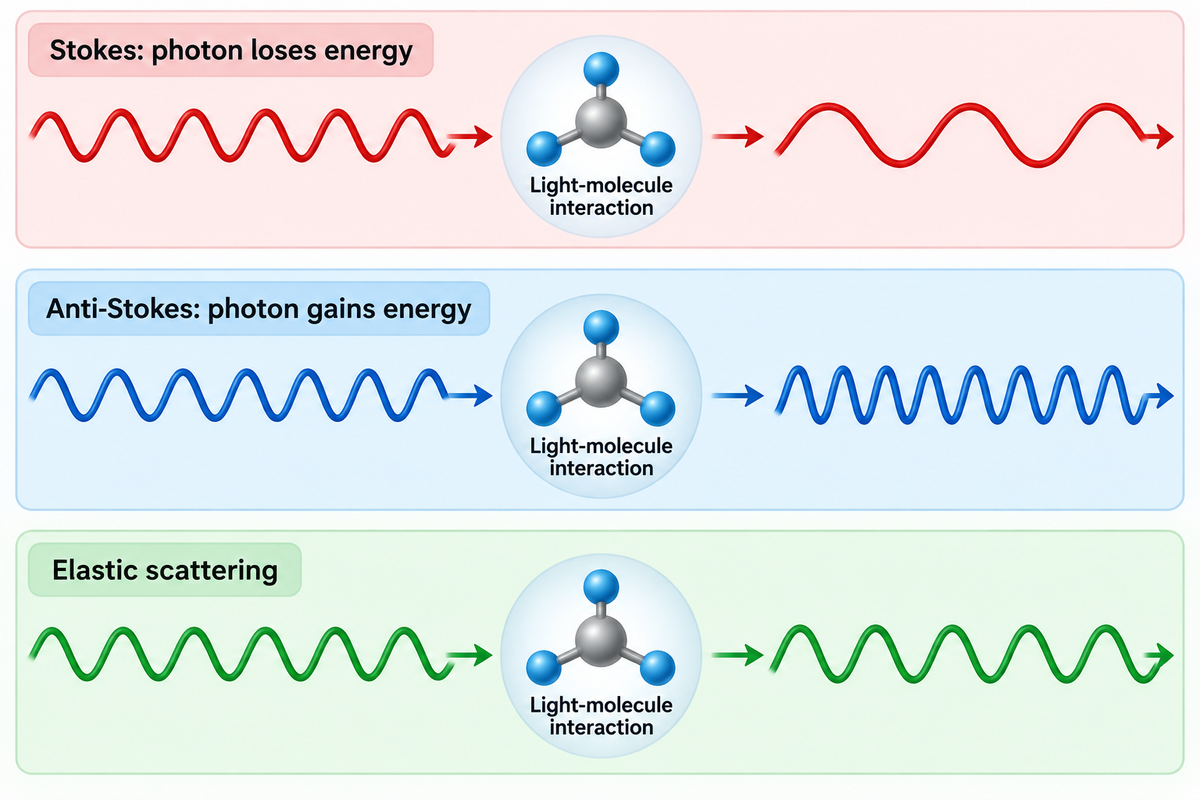
The inelastic process is known as Raman scattering. Raman spectroscopy relies on an interaction between laser light and the sample’s electron cloud. In the Raman scattering process, Raman scattered photons have a different energy than the incident light. Stokes scattering means the photon loses energy and anti-Stokes Raman means the photon gains energy. The difference in energy is due to a molecular or lattice excitation. Most of the collected light is elastic scattering, so the optical system needs to remove the elastic scattering in order to identify the Raman signal.
Raman active modes change polarizability, meaning the ease with which the electron cloud distorts. In infrared light activity, there must be a change in the dipole moment. The Raman Spectroscopy teaching package from the University of Cambridge explains Raman selection rules and the conditions of mutual exclusion. Therefore, different modes can greatly affect IR and Raman spectra.
Spontaneous Raman scattering is weak. Therefore, the pattern measured is a combination of the material response, excitation, optics and detector. Different Raman scattering cross-sections explain why, in a given case, a component with strong Raman bands may dominate a mixture, even if it isn’t the most plentiful component. Conversely, weak Raman signals can leave a constituent poorly represented. Peak height by itself isn’t an accurate method for determining the amount of a given component in a mixture.
Let’s say a quality engineer wants to see if the base polymer changed when comparing a clear film to a pigmented film. Comparing only the largest band may instead highlight the pigment, particularly if it scatters strongly or fluoresces. Keeping the investigation focused on the base polymer is useful. The diagnostic polymer pattern, support blank and an appropriate reference will help answer the question related to the base polymer. A bond strength complaint would be a separate investigation.
Practical Boundary: choose the analytical endpoint before choosing an instrument. Polymer identification, spatial distribution and a quantified structural property require different references and interpretations.
Reading a Raman Shift in Polymer Spectra
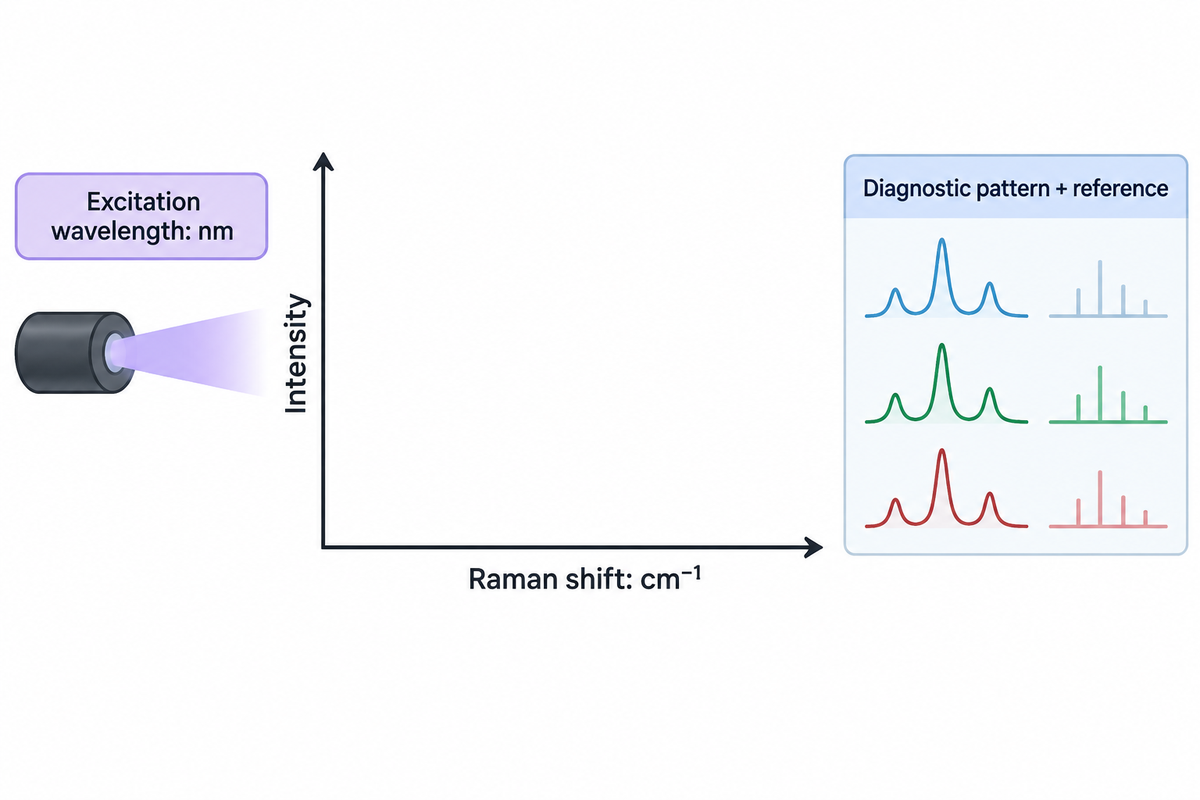
A Raman shift describes the energy difference between the excitation and scattered light, and is usually reported in inverse centimeters. Interpreting polymer Raman spectra means checking a pattern of diagnostic bands, their shape and measurement conditions. A peak position and/or a hit in a library become helpful only when the reference and the sample material are adequately aligned.
The laser wavelength, such as 532 nm or 785 nm, describes the excitation light. A band reported at 1001 cm−1 describes a Raman shift. These quantities have different meanings and units. A Raman spectrometer converts its detected optical signal into an energy-relative spectral axis; the reader should retain the original axis labels rather than compare an absolute wavelength plot with a shift plot.
Take some characteristic Raman bands rather than the strongest Raman peak. Look at the locations, widths, and relative patterns of peaks in the Raman spectrum, and search for features that aren’t in agreement with the suggested material. The spectral range is important: a reference band out of the measured range can’t be examined. A range that omits a useful band is a sampling limitation, not a negative identification result.
A concrete public illustration comes from Iranmehr and colleagues’ Automated Background Noise Removal from Substrate Materials study. In the tested PET data, the authors retained bands at 1615 cm-1 and 1726 cm-1 immediately after taking out PDMS background. They also examined a polystyrene feature near 1001 cm−1 in a silicon-background dataset. These are observations about the study’s samples and processing technique, not a normal peak list for every film.
Example: An unknown laminate has one feature near a library polymer band; the rest of the diagnostic region is obscured. One may tentatively identify it, recording the obscured region. Calling the sample positively identified would give it more specificity than it deserves. A second excitation, or a complementary spectrum, may resolve the ambiguity; a more attractive plot alone won’t.
Peak positions and peak intensities need different checks
Wavenumber calibration concerns the horizontal axis. ASTM E1840-96(2022), Standard Guide for Raman Shift Standards for Spectrometer Calibration, supplies reference shift values for common chemicals. A reference measurement helps detect an instrument-axis problem before a small peak movement is interpreted as a material change.
“Wavenumber calibration is an important part of Raman analysis.”
The intensity of the Raman bands is a separate axis of comparability. ASTM E2911-23, Standard Guide for Relative Intensity Correction of Raman Spectrometers, describes instrument-response correction and its validation. Filters, collection optics, gratings and detector responses may all contribute to differences in relative peak intensities between instruments, including instruments using the same excitation wavelength. Peak position matching does not account for relative peak intensity differences.
Algorithmic pre-processing is also a factor. Samuel and colleagues’ 2021 spectral-matching study found that small baseline or noise changes could produce incorrect matches with several common approaches. Keep candidate identities, preprocessing settings and reference provenance with the interpretation.
Raman spectroscopy can provide detailed information about chemical structure when the measured features are assigned appropriately. For structural questions, band ratios may vary with orientation and measurement geometry as well as the state of the material. The difference is important when considering polymer crystallinity and measurement limitations. A measured ratio becomes a crystallinity value only when it’s supported with an appropriate calibration or model.
A spectrum containing PET features at 1615 cm −1 and 1726 cm −1 still needs a sampling and reference context. These features were reported in a substrate removal study by Iranmehr and coworkers. Retaining a recognisable pattern is one task; establishing identification reliability or quantitative composition is another.
Fluorescence: When the Background Hides Raman Signals
A sample fluorescence background can obscure Raman signals. Additives, colorants, and degradation products in a polymer film can contribute to the background. The support for the film can also contribute. Changes in excitation can help reduce background, but overlapping layers or sample alteration may necessitate changes in sampling and analytical method.
A high baseline is not simply extra intensity that can always be subtracted away. Its associated noise may remain comparable with the Raman bands in the spectrum. Smoothing can make a plot look cleaner while weakening small peaks or altering their shapes. Retain the measured trace and assess peak visibility rather than assuming baseline flatness.
In the 2024 review Artifacts and Anomalies in Raman Spectroscopy, by Vulchi and co-workers, the notation of sample-related artifacts, sampling artifacts, and computational artifacts is useful. It’s important to appreciate that heating, fluorescence, and container contributions arise for different reasons. A changing spectrum during exposure deserves a different response from a stable broad background. Baseline problems should be addressed separately. Treating both as a baseline issue may hide an actual change in the sample being measured.
3-Trace Signal Attribution
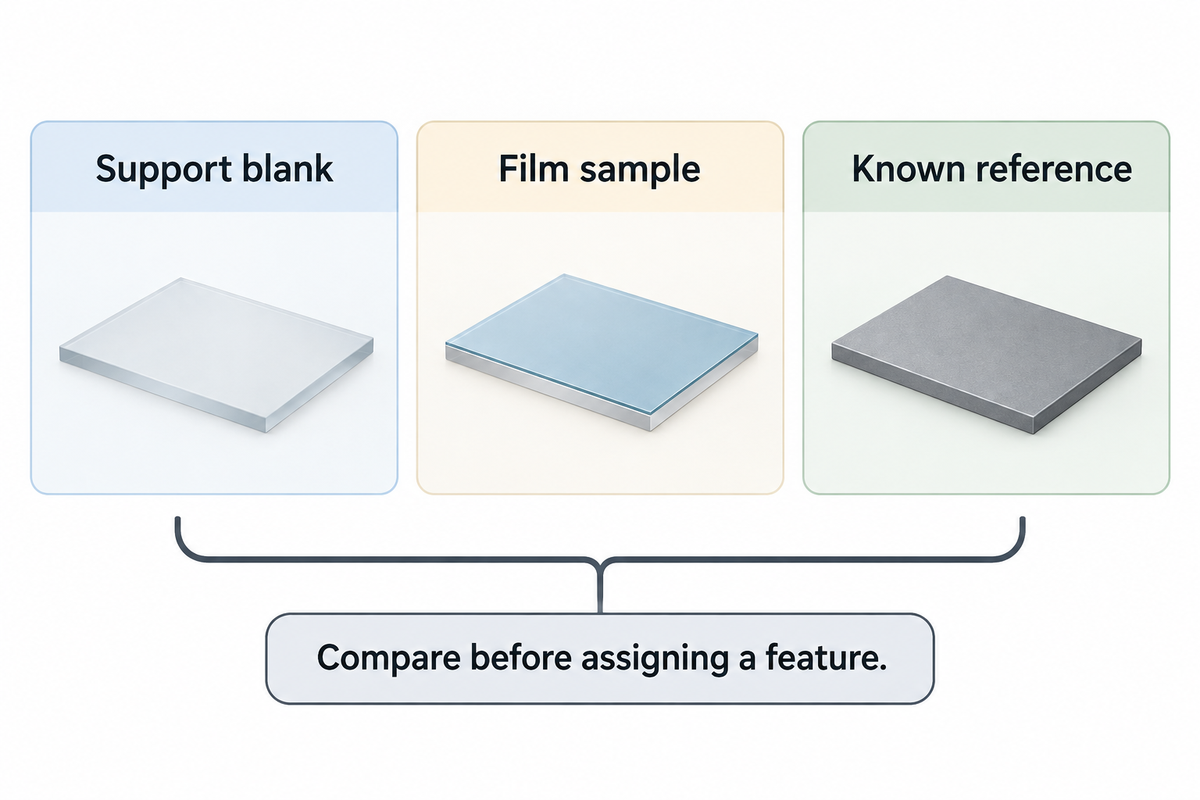
3-Trace Signal Attribution compares a support blank, a film and a known reference before assigning a feature to a polymer.
Use the same support material and comparable acquisition conditions for the blank. The known reference is a separate material reference, with its grade and condition recorded. Neither a blank support nor a generic polymer library substitutes for the other. The following filled examples are interpretive aids derived from sampling and artifact research.
| Observed comparison | Working interpretation | Useful next action |
|---|---|---|
| The broad background appears in the blank and film traces. | The support is a plausible contributor. | Compare a suitable alternative support before assigning the background to the polymer. |
| The blank is quiet but the film has a broad background. | The film or something on it contributes luminescence. | Compare excitation and a fresh film location while retaining raw data. |
| A reference polymer band is visible in several film locations. | The candidate has repeatable local support. | Check the rest of its diagnostic pattern and competing candidates. |
| Only a pigment-like pattern dominates the film trace. | The strong scatterer may conceal the base-polymer response. | Use a sampling or complementary method directed at the base material. |
| Bands change during repeated exposure at the same spot. | Heating or photochemical alteration is a candidate cause. | Stop that exposure and compare a fresh spot with a lower-dose approach. |
| One isolated narrow spike appears in a single acquisition. | A transient detector artifact is a candidate. | Compare repeat acquisitions before treating it as a material band. |
| The processed trace has peaks absent from the measured trace. | Processing may be creating or overstating features. | Review the algorithm and compare alternative defensible settings. |
| Both film and support bands remain in a depth profile. | The sampled volume includes more than the intended layer. | Review focus, layer geometry and an accessible section or surface. |
| The reference matches one region but conflicts elsewhere. | A mixture, unsuitable reference or wrong identity remains possible. | Retain alternatives and obtain the missing diagnostic information. |
A counterexample is presented by David Tuschel in his article, “Selecting an Excitation Wavelength for Raman Spectroscopy.” His commercial polystyrene pipe gave a better response at 785 nm than at 532 nm. However, a microscope slide in the article showed strong 785 nm fluorescence that obscured the fingerprint region. The article identifies Tuschel as a Raman applications manager at HORIBA Scientific. These examples are attributed case studies that don’t apply generally to glass or polymer films.
Picture a transparent film on a glass slide. At 532 nm, the operator sees a broad background and switches to 785 nm. The target polymer may fluoresce less, but the support now contributes more light through the film. If only the film-on-glass result is compared, the operator could reject the longer wavelength for the wrong reason or misattribute the problem to the film formulation. A different suitable support can then be evaluated without treating support subtraction as an automatic cure.
What can Raman spectroscopy not detect?
Raman spectroscopy is unable to show a Raman inactive vibration, as depicted in the selection rules. A constituent can also escape detection because its useful bands are too weak, obscured, outside the recorded range or sampled poorly. These limitations are often true of a given measurement, and can’t be generalized to a list of polymers or a single concentration threshold beyond which a polymer can’t be detected.
Longer exposure may collect more useful signal, but it does not resolve every overlap and can increase the accumulated dose. Photobleaching can reduce fluorescence while changing the sample. A flat corrected spectrum, therefore, isn’t a chemical absence test. Indicate what diagnostic information was obtained and what question remains.
At 785 nm, the support can be the dominant fluorescence source, especially if the polymer benefits from an excitation change. In Tuschel’s glass vs. polystyrene comparison, the practicable choice is clear: evaluate the support separately; and judge the target bands and noise together rather than base a choice on the wavelength from the baseline alone.
Wavelength and Instrumentation for Film Samples
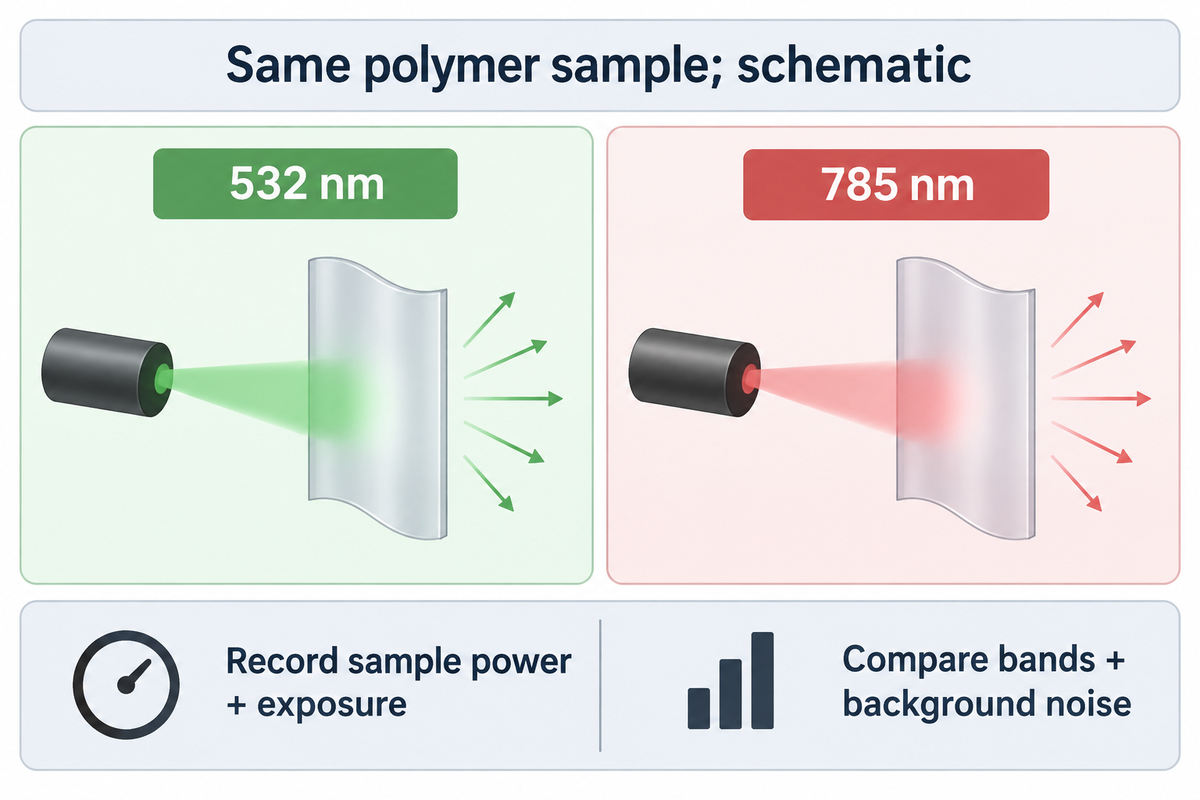
Excitation wavelength should be chosen based on a measured sample, considering useful Raman bands, fluorescence and changes to the material, together. Shorter wavelengths can provide greater scattering; longer wavelengths can minimize fluorescence in some materials. Detector response, optical sampling, and laser dose can reverse a choice based solely on wavelength.
Many Raman systems offer 785 nm excitation, but availability isn’t a result on the film in question. Moving from 532 nm to 785 nm changes the excitation and detected optical wavelengths. Moving to 1064 nm introduces further detector and instrument considerations. Comparing two instruments without recording those differences isn’t a controlled test of the laser wavelength.
Hardy and Chu review scattering, fluorescence and damage in Raman spectroscopy in Laser wavelength selection in Raman spectroscopy (2025). The published review describes the trade-offs of scattering, fluorescence and other factors in Raman spectroscopy. Their 2025 review explains why compensating for weaker scattering with more power can harm heat-sensitive samples. It also discusses detector response at the scattered wavelengths. A nominal excitation specification of a Raman microscope can’t describe the entire measurement chain.
Compare wavelengths
- Use the same material and identify the sampled layer.
- Record power at the sample and exposure settings.
- Compare diagnostic-band visibility and background noise.
- Retain a fresh-spot comparison for material alteration.
Compare instruments
- Record detector, grating and collection optics.
- Distinguish measured range from useful sensitivity.
- Check relative-intensity response correction.
- Separate scan spacing from demonstrated resolution.
The power that reaches the sample influences the strength of the Raman signal. A setting of 50% describes a fraction of that particular system’s available output, after its own optical losses and controls. It is not a transferable number of milliwatts. Exposure time and repeated accumulations also affect dose. A low nominal power can also concentrate energy to a small area.
Variability is evident in the methods. A comparative study of Polarized Raman spectroscopy and Birefringence in printed polycarbonate published by Hassan and colleagues used 514 nm laser excitation and approximately 3 mW of power. That setting was used on printed polycarbonate; a coloured TPU laminate can absorb and dissipate heat differently, so check its power in a fresh-spot trial.
During a film trial, compare fresh locations and capture any visible changes, as well as spectral changes. A growing band after multiple energy source exposures may indicate a change in the location being assessed. Increasing the laser power to “rescue” a weak Raman band risks altering the material being analyzed. If the useful pattern remains inaccessible in the allowed sample exposure, it’s better to change the sampling or analytical route rather than accumulate damage to a location.
Confocal Raman microscopy provides additional spatial selection, but the effective sampling volume still depends on wavelength, numerical aperture, refractive index, transparency and alignment. A confocal Raman microscope can map Raman images across a film; the pixel spacing used to capture the images doesn’t by itself define chemical separation of adjacent layers. Instrumentation needs to be evaluated with respect to actual layer thickness and optical behavior.
Choosing between 532 nm, 785 nm and 1064 nm is a sample-and-instrument decision. Hardy and Chu describe the competing signal and fluorescence effects; ASTM E2911-23 adds the separate question of intensity response. A lower baseline is desirable only if diagnostic bands remain measurable and the sample remains representative.
Thin Films: Separating Polymer, Layers and Substrate
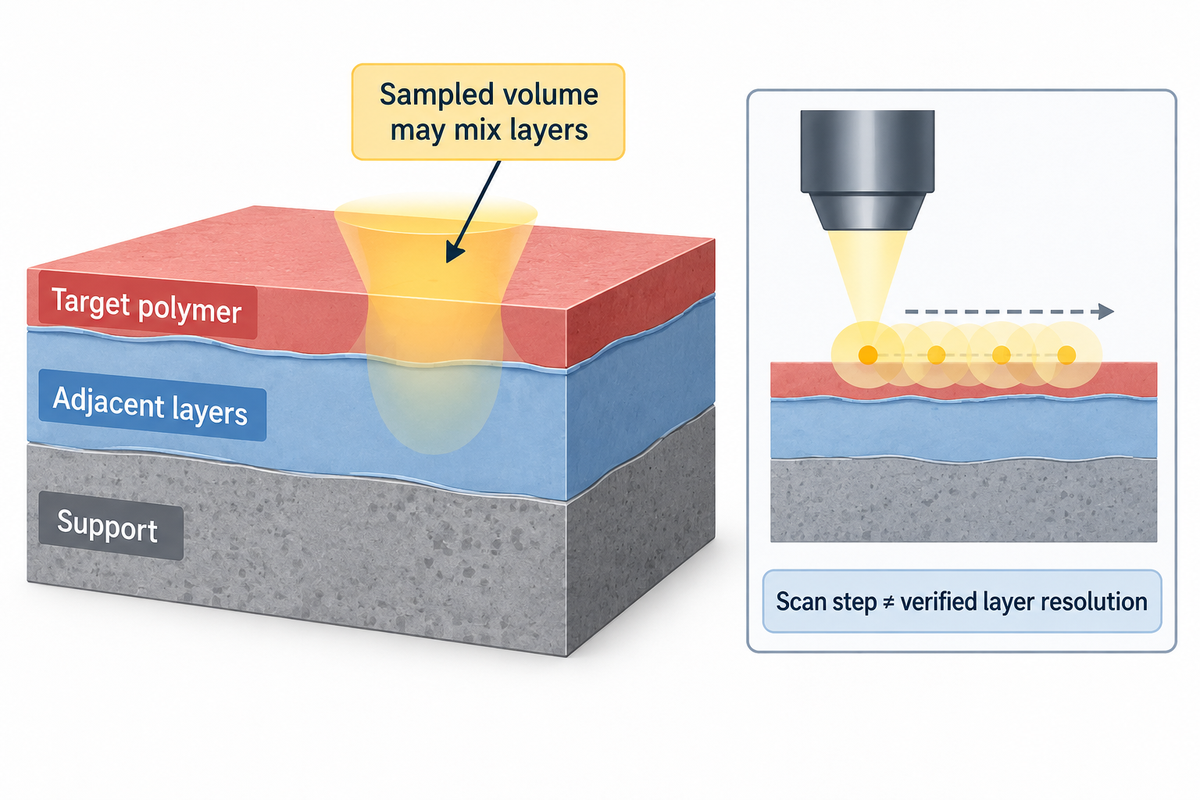
Thin film spectra may contain light from the targeted polymer and/or adjacent layers as well as from the support. Confocal collection narrows the sampled region but does not automatically isolate a buried layer. Film transparency, refractive index and scattering affect which bands are observed and how a depth profile should be interpreted.
An unsupported film and the same film on glass are different optical samples. The support can also contribute to Raman scattered light or fluorescence. It can also change optical propagation, so a supported-film spectrum isn’t always a simple case where a blank can totally remove what the support adds. The modelling of multiple reflections and interference in Ramsteiner’s and colleagues’ study of thin-film Raman interference, along with their experimental work on amorphous hydrogenated carbon films on silicon, supports some sampling fundamentals, and serves as a good starting point, but effect sizes can’t be extrapolated to polymer films.
For instance, in some cases of TPU film it may be the layer selected for a bonding or lamination construction. Raman sampling should distinguish that polyurethane layer from its carrier, coating and neighbouring materials, so the observed spectrum answers a question about the intended film rather than the entire stack. The sample description should include the colorants, additives and the support.
Film orientation also makes a difference. Polarized Raman measurements can respond to molecular orientation, while a different optical method can average a different region or structural scale. In the NIST-hosted printed-polycarbonate comparison, Raman and birefringence measurements did not give interchangeable orientation readouts. The limits of sensitivity of the original study pertain to the material and method of that particular study and not to all grades of polymers.
A depth profile and a cut section can disagree
Fran Adar’s Evaluating a Multilayer Polymer Film by Raman Microscopy presented a comparison of a commercial laminate’s cut-section and a confocal laser microscopy depth profile. Adar, identified in the article as a Principal Raman Applications Scientist at HORIBA Scientific, explained that the refractive index mismatch in the sample caused the internal focus to be spread, and stated that oil immersion improved the measurement. However, the measurement profile still didn’t perfectly match the cut-section map.
The cross-sectional spectra used 638 nm excitation, with 2 µm steps in one direction and 1 µm in the other. The reported slit and hole settings were 50 µm and 100 µm. Those are acquisition settings from that particular case. They aren’t a 1 µm accuracy claim, a general minimum film thickness, or a recommended configuration for every multilayer sample.
Scattering of light is also discussed in the reference as an explanation for missing penetration. A TiO2-containing polyethylene layer visible in the cut-section analysis was not resolved in the depth profile, and component contributions mixed. An image of a depth profile can be seemingly detailed and still miss component layers of a multilayer film.
Example: a purchasing team receives a spectrum from a transparent 20 µm film on a carrier and wants to identify a proposed 5 µm bonding layer. A single surface acquisition combines an optical sampling volume with the unknown layer construction. The first decision is to identify which side was measured and whether the support or coating appears in the trace. If a cut section is permitted, it may help examine the layer order. If the sample must remain intact, the laboratory needs an alternative sampling strategy and an explicit unresolved outcome when the buried layer can’t be separated.
Sample preparation has tradeoffs. Soft layers may be deformed when cut, and/or material from the blade or fixture may be introduced. Immersion may introduce yet another material in the optical path. When possible, an unprepared portion should be kept, and preparation artifacts should be distinguished from the original construction. It isn’t appropriate to make a general “no preparation needed” claim for all thin films.
Subtracting the substrate has assumptions. Iranmehr and colleagues’ 2025 algorithm used separately measured background spectra and tested specific particle/support systems. A background measurement can help when its features represent the support contribution, but changing the optical geometry or the sample’s interaction with the support may change that contribution. Automatic identification and accurate quantification were future problems to be studied.
A layer’s chemistry and its dimensional response deserve separate measurements. Raman microscopy can locate a candidate polymer, while thermomechanical analysis of a film investigates deformation under specified loading and temperature. Using each method for its own endpoint prevents a chemical map from becoming an unsupported processing-performance claim.
Adar’s laminate case used 638 nm excitation and 2 µm by 1 µm mapping steps, yet the depth profile and cut-section map separated layers differently. Sampling density describes where measurements were taken. Optical focus, scattering and construction determine whether those measurements distinguish the layer needed for a materials decision.
IR and Raman: Choosing Complementary Evidence
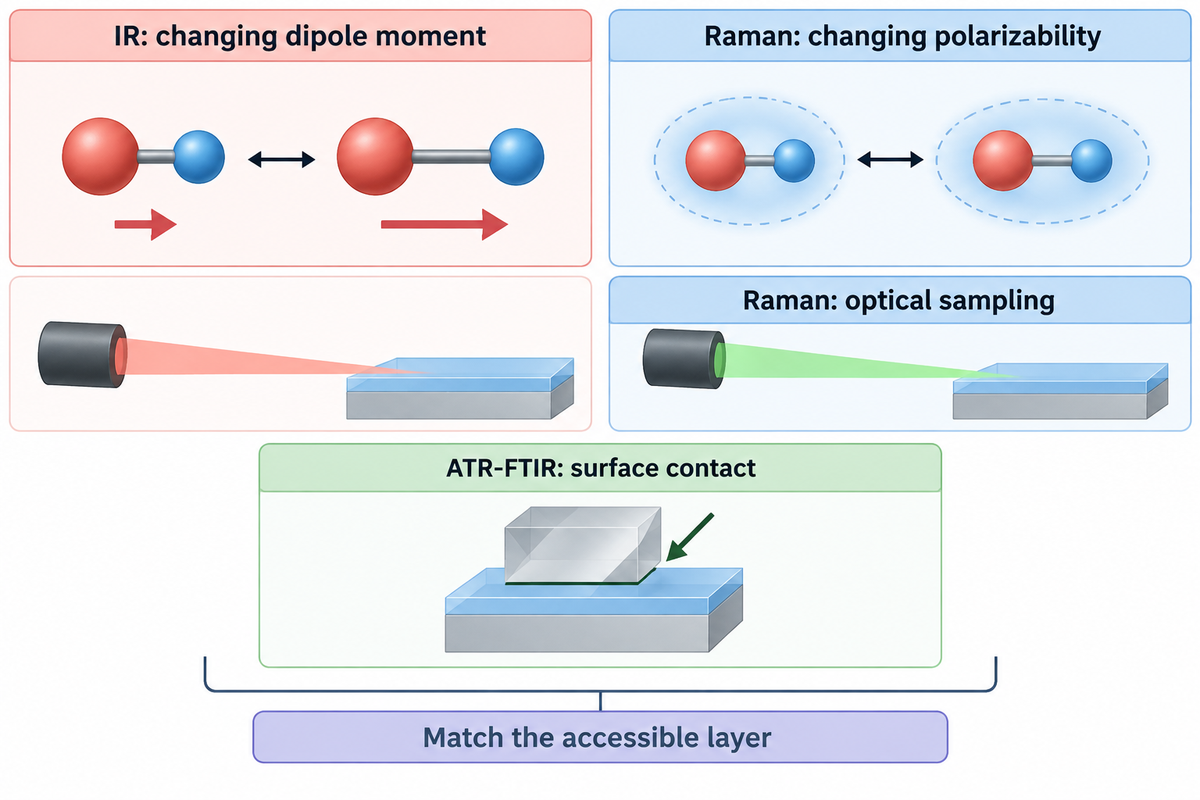
Raman and Infrared spectroscopy measure different sample interactions and therefore vibrational activity. For an accessible film surface, ATR-FTIR is often a practical complementary chemical measurement. The choice still needs to account for contact, layer access and the unresolved question rather than assume the two spectra are interchangeable.
What is the difference between IR and Raman spectroscopy?
As a vibrational spectroscopy technique, IR measures absorption associated with changes in dipole moment, while Raman scattering is an inelastic interaction associated with changes in polarizability. Their band intensities and selection rules differ, so a feature weak in one technique may be easier to examine with the other. The simple mutual-exclusion rule applies to centrosymmetric systems, rather than every vibration in every polymer.
Jones et al.’s review of Raman Techniques: Fundamentals and Frontiers establishes the physical basis for this distinction. Various sensitivities are useful when one spectrum leaves the composition uncertain. A complementary measurement works best when it tests a specific alternative: the base-polymer family, an accessible coating or a suspected constituent.
| Question or sample state | Raman contribution | Complementary route or condition |
|---|---|---|
| Accessible polymer surface, uncertain identity | Diagnostic band pattern and reference comparison | ATR-FTIR checks complementary absorption features when contact is acceptable. |
| Strong film fluorescence | An excitation trial may expose useful bands. | IR avoids that Raman fluorescence measurement problem. |
| Thin transparent film on glass | Film and support may both contribute. | Evaluate a suitable support and an accessible-film IR measurement. |
| Buried layer within a laminate | Confocal profiling may locate chemical changes. | A permitted cut section or other depth-sensitive approach tests layer assignment. |
| Suspected pigment dominance | Strong pigment bands may be detectable. | Direct the complementary measurement at the base-polymer question. |
| Different relative intensities across instruments | Instrument response and geometry affect comparison. | Review relative-intensity correction and compatible reference conditions. |
| Quantitative crystallinity question | Selected spectral features may support a calibrated model. | Use a material-appropriate structural method and calibration. |
| Molecular-weight-related concern | Chemical identity can narrow the investigation. | A suitable solution or molecular-weight method addresses the intended quantity. |
| Thermal or mechanical complaint | Chemistry helps identify what material is present. | Use a test of the thermal or mechanical property under its own conditions. |
ATR-FTIR requires contact with the accessible material; a surface measurement can emphasise a coating rather than the buried layer of interest. Raman can be used for optical spatial selection, but in some cases, fluorescence or other challenges may limit access. A disagreement should be checked against sampled regions, as well as against reference conditions, before it’s used as evidence that a particular measurement is wrong.
Raman spectroscopy is used to investigate chemical structure. Vibrational spectroscopy and X-ray diffraction can address different aspects of crystalline structure. Other questions concern solution behaviour, where intrinsic viscosity measured under specified solution conditions addresses a different quantity. Adding a second technique is useful when its measured quantity resolves the remaining decision, rather than simply producing a second report.
A weak band at a particular Raman shift in cm−1 may be easier to examine through a complementary IR-active vibration, but the two methods can sample different regions of a film. The chemical question needs to be identified, as well as the layer that’s accessible prior to comparing the results. The selection rules and the contact conditions need to be satisfied in the explanation of the results.
Beyond Conventional Raman: Use a Method for a Defined Obstacle
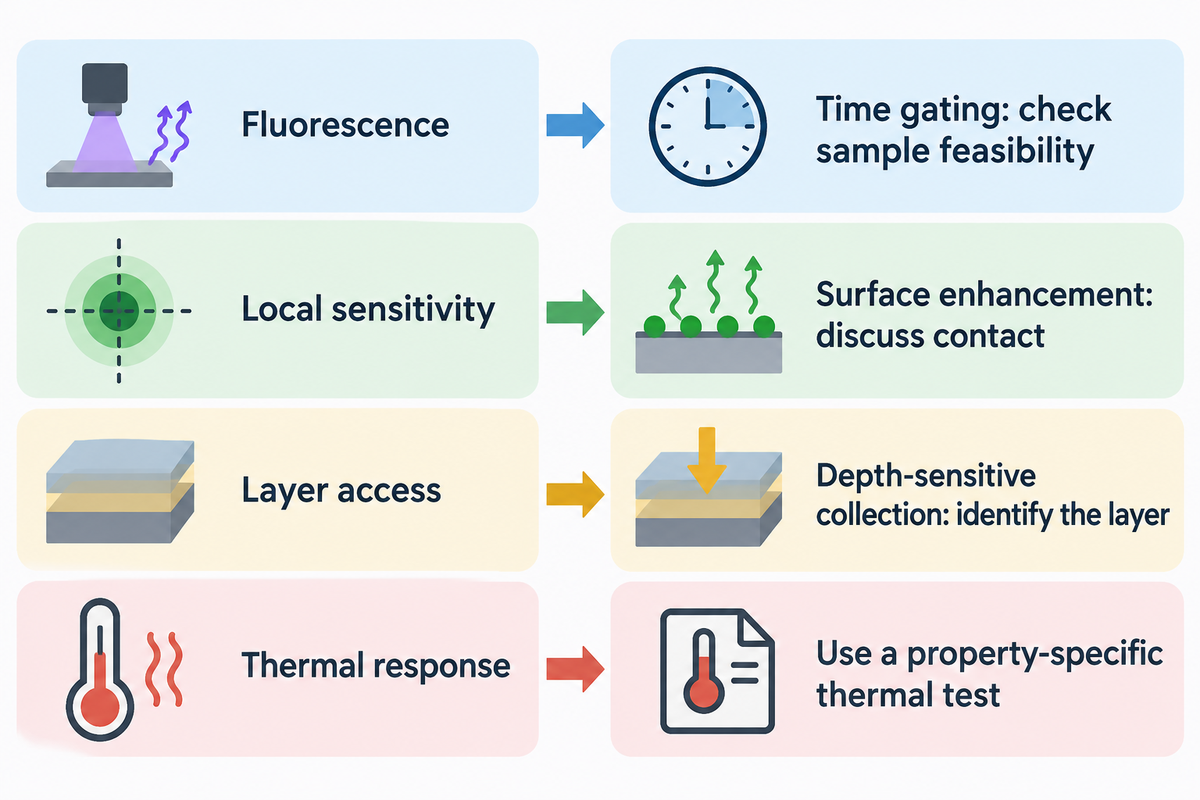
Different methods than conventional Raman spectroscopy can be used to adjust the excitation or collection geometry or to use different means to increase the signal in order to address a specific limitation of the measurement. Using a given method is determined by the missing information: background rejection, local sensitivity, access to a given layer or map speed. A technique name alone says little about its suitability for the film and decision being tested.
Laser and detector developments made Raman spectroscopy helpful for many investigations of materials. On the other hand, variations of Raman spectroscopy address other problems. Resonance Raman spectroscopy can, in certain cases, increase the intensity of a band with respect to others, by varying the excitation to be near an electronic transition. Therefore, the dominant components of the Raman spectral pattern can be changed. In this case, a reference acquired under different resonance conditions may show poor comparison.
Surface-enhanced Raman spectroscopy relies on an enhancing surface near the analyte. Surface enhanced Raman scattering can improve sensitivity of Raman measurements, but it alters the sample’s measurement environment. Tip-enhanced Raman spectroscopy confines enhancement near a probe. Neither of the two enhanced Raman spectroscopy routes should be viewed as a routine method to identify an untouched multi-layer film without discussing access and preparation.
Spatially offset Raman spectroscopy modifies where illumination and collection occur to benefit contributions from below a surface. Coherent anti-Stokes Raman spectroscopy and stimulated Raman approaches use nonlinear excitation schemes; they’re different from merely increasing exposure on a conventional Raman microscope. The Jones and colleagues review of Raman fundamentals and frontiers describes the mechanisms and the types of experiments that are required to evaluate them.
Time gating is another route for fluorescence. In Time-gated Raman spectroscopy of recovered plastics, Kotula and colleagues reported in 2022 that the approach reduced background in recovered plastics containing colourants or additives. The examples included blue, white and black materials. The useful lesson is that collection timing can address a particular interference mechanism; the sample-specific feasibility question remains.
Different kinds of optical approaches are also described in patent disclosures. US12339165B2, published in June 2025, describes a Pendar standoff Raman apparatus with scanned illumination and differential measurements. Distinct from the NIST demonstration, this apparatus uses differential measurements and beam scanning. Its family traces priority to 2018. A patent date identifies a disclosure, rather than a new performance result for a TPU film.
When the remaining question is thermal response, another Raman variant may be an unnecessary detour. Heat-capacity measurements by differential scanning calorimetry address energy absorbed during a defined thermal programme. The analytical route should follow the required property and sample condition.
Selection rule for the work request: name the obstacle before naming the advanced method. For 1064 nm excitation, the lab should still think about scattered light sensitivity and spatial access. For surface enhancement, the lab should think about contact with the enhancing material. For depth-sensitive collection, the lab should determine which layer is involved. These are different feasibility tests, even if all of these involve Raman scattering.
Requesting a Raman Test That Can Support a Decision
A useful Raman test request describes the film layer, the chemical question and the sort of information required to come to a conclusion. It describes support and preparation constraints, then specifies raw spectra, acquisition conditions, reference information and processed results. The report should explain when identification is unresolved due to fluorescence, spectral overlap or sample change.
Quality Raman spectra begin with a defined analytical scope. The directive “Identify this plastic” sends the laboratory team to guess the target in the base film, pigment, coating or bonding layer. “Compare the available bonding layer to the supplied known reference and distinguish support contributions” clarifies the directive. The same distinction helps procurement compare quotations and helps a plant operator avoid treating a supplier’s material name as the analytical answer.
4-Exit Evidence Ladder
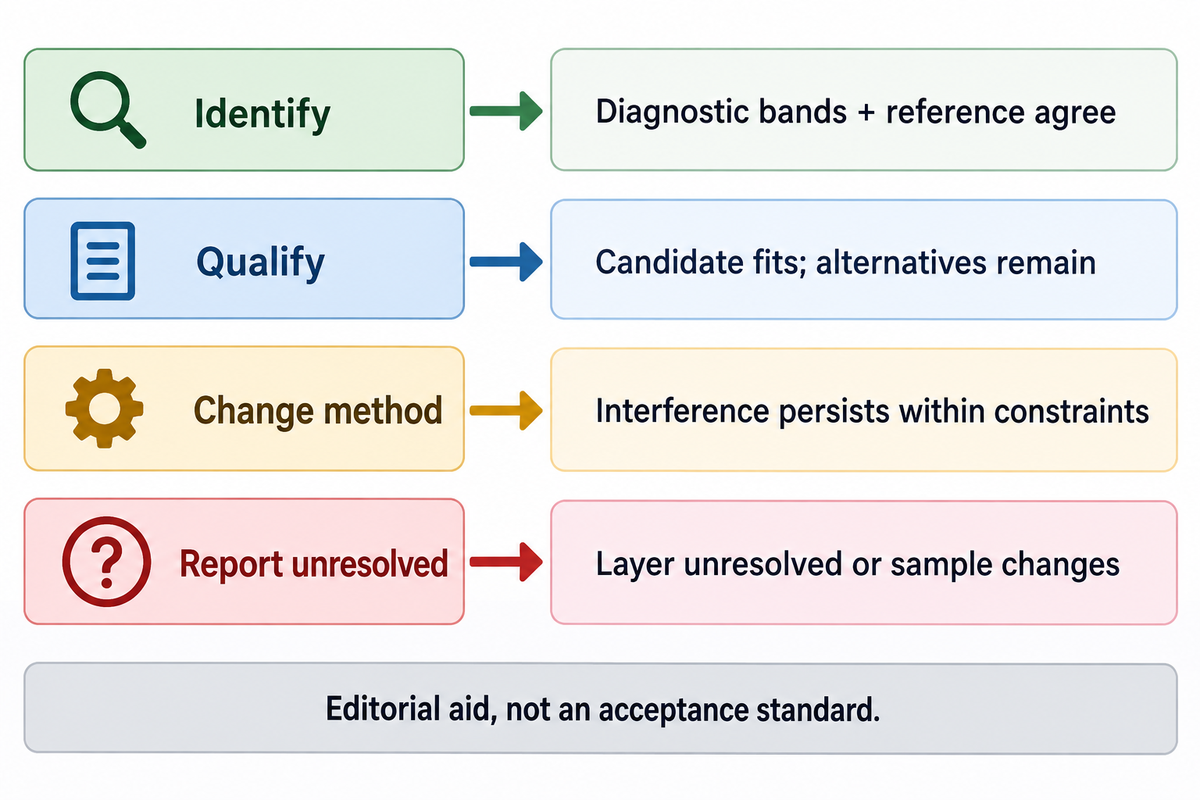
4-Exit Evidence Ladder assigns a film investigation to identify, qualify, change method or report unresolved, based on the information collected.
The exits below are an editorial decision aid, not a numeric acceptance standard. The outcome depends on the material question and the measured observations. A quality-release limit should be agreed to and validated in a separately negotiated, validated method.
| Exit | Example result | Decision supported |
|---|---|---|
| Identify | Several diagnostic bands agree with the appropriate known reference; support and sampled layer are documented. | Report the supported material assignment with its sample and method conditions. |
| Qualify | A polymer family fits, but pigment dominance or missing diagnostic information leaves alternatives. | Report the candidate and limitation; avoid converting it into a definitive composition result. |
| Change method | Fluorescence or layer overlap persists within permitted exposure and preparation conditions. | Use a targeted excitation, sampling or complementary-method trial. |
| Report unresolved | The target layer cannot be separated, references conflict or exposure changes the sample. | Keep the identity question open and state the specific information required next. |
Errors and Mistakes to Avoid when Analyzing Raman Spectra, by Ryabchykov and others, explains the importance of recording calibrations and processing and why independent measurements are necessary when assessing the performance of a model. Repeated spectra from one spot are not automatically independent validation samples. Thus, a high model score should come with the intended sample population of the model, and the evaluation methodology.
A filled film-testing request
Example: the sample is a clear laminate whose accessible bonding layer requires chemical comparison with a retained reference. Cutting is allowed on one portion; the rest must be retained for a later physical test. The request can include the following information without prescribing an unsupported laser recipe.
| Request field | Filled example | Purpose |
|---|---|---|
| Target | Accessible bonding layer on side A, compared with the retained known film | Separate the analytical target from the whole construction. |
| Sample condition | As received, with side A and carrier marked; retain an unprepared portion | Preserve preparation and orientation context. |
| Controls | Carrier blank and known-reference film supplied separately | Distinguish support contribution from reference agreement. |
| Permitted preparation | One portion may be sectioned; document the prepared location | Make destructive access an explicit choice. |
| Acquisition record | Wavelength, measured sample power, objective, exposure, accumulations and spectral range | Make the measurement interpretable and repeatable. |
| Data delivery | Raw spectra, processed spectra, processing settings and sampled-location image | Separate measured information from software treatment. |
| Interpretation | Candidate identities, diagnostic features, reference provenance and unresolved alternatives | Connect the pattern to a bounded conclusion. |
| Follow-up | Specify the unanswered chemical question before proposing another method | Keep a second test directed at the decision. |
Request the laboratory confirm what controls and alternative excitations it can actually provide, how it handles relative-intensity response, and what it provides when the library match is ambiguous. Request authorization for sample preparation, and specify the data format required in the same work request. These allow a quotation to be provided describing the real analytical scope rather than the general capabilities of the instrument.
For a report already received, sample, method and conclusion must be combined. The Bonding knowledge hub on interpreting a materials test report provides a broader context to compare what was requested with what was measured. The most useful follow-up work addresses the missing layer or diagnostics directly.
Key takeaway
A film result at 785 nm is useful when its diagnostic pattern, sampled layer and reference comparison support the stated conclusion. Fluorescence reduction, a clean baseline and a high library score answer different parts of that evaluation.
Raman Spectroscopy FAQ
Is Raman spectroscopy quantitative?
Raman spectroscopy can be quantitative when the measured signal is linked to concentration or another quantity through a validated calibration.
Peak intensity also changes with collection geometry, instrument response and the components present. A calibration must represent the intended material and measurement conditions, and its performance needs independent evaluation. A library identity score is a different output from a concentration result. For a film mixture, the laboratory should define the constituents and sampling region before treating band intensity or a model prediction as quantitative composition.
Is Raman spectroscopy destructive?
Raman analysis can preserve a sample, but laser heating or photochemical changes can damage susceptible materials.
Dark, absorbing or heat-sensitive regions deserve particular care. Power at the sample, focus and accumulated exposure all affect the measurement. Comparing a fresh location with the exposed spot can reveal changes that would otherwise be mistaken for the original material. Cross-sectioning and some surface-enhancement approaches also change preparation conditions, so a request for an intact sample must be stated before selecting the analytical route.
Can Raman spectroscopy detect water?
Water has Raman-active vibrations, although its response can be weak in a spectral region used for another analytical task.
A weak water contribution can make some aqueous Raman measurements practical, but it doesn’t mean water is universally invisible. Detecting or quantifying moisture in a polymer requires a method sensitive to the relevant water state and concentration. A polymer-identification spectrum, especially one with a limited recorded range, shouldn’t be read as a moisture measurement simply because no obvious water feature is visible.
Is Raman spectroscopy infrared?
Raman spectroscopy measures scattered light, while infrared spectroscopy measures absorption.
Both examine vibrational information, with different selection rules. A Raman instrument may use near-infrared excitation, but that doesn’t make its measurement an infrared absorption spectrum.
How expensive is Raman spectroscopy?
One university price list sets Raman instrument use at $180 per hour for for-profit users (University of Colorado Boulder); the hours a film job needs follow from its sample and analytical scope.
A straightforward comparison of accessible material with a supplied reference is a different job from identifying a buried layer in an unfamiliar laminate. Preparation, multiple excitation trials, mapping and interpretation can change the work required. A quote should therefore separate the initial feasibility check from additional measurements and reporting.
Provide the target layer, sample condition, controls, permitted preparation and desired conclusion. Specify whether raw spectra and processing settings are required, and whether the laboratory should propose a complementary measurement when Raman leaves the identity unresolved. Comparing quotations with those same fields gives procurement a meaningful scope comparison. Instrument purchase prices, service prices and the cost of building a validated quantitative method are different budgets.
How long does it take to obtain a Raman spectrum?
In one Spectroscopy tutorial, each spectrum used 60 seconds of total exposure, collected as 60 exposures of 1 s or 2 exposures of 30 s; a defensible film identification can also require preparation, controls and several measurements.
Weak scattering, fluorescence or mapping can extend acquisition and analysis. A multilayer investigation also needs time to establish which region produced the signal. More accumulations at one spot don’t replace reference comparison or demonstrate that the film remained unchanged. The relevant turnaround is the time needed for the agreed analytical conclusion and data package, rather than an instrument’s shortest exposure setting.
Connect the spectrum to the film question
Define the layer and the unresolved material decision before arranging further testing. Keep chemistry, construction and physical performance as explicit parts of the investigation.
Published example measurements are attributed to their authors. The filled decision aids are editorial synthesis for interpreting film measurements; the application examples do not describe Teng Yang customer tests.
References & Sources
- Raman Spectroscopy teaching package – University of Cambridge, DoITPoMS.
- Automated Background Noise Removal from Substrate Materials — Iranmehr and colleagues, ACS Omega, 2025.
- E1840-96(2022): Raman Shift Standards for Spectrometer Calibration — ASTM International.
- E2911-23: Relative Intensity Correction of Raman Spectrometers-ASTM International.
- On Selecting a Suitable Spectral Matching Method for Automated Analytical Applications of Raman Spectroscopy — Samuel and colleagues, ACS Omega, 2021; public abstract.
- Artifacts and Anomalies in Raman Spectroscopy – Vulchi and colleagues, 2024.
- Selecting an Excitation Wavelength for Raman Spectroscopy (David Tuschel, Spectroscopy, 2016; author affiliated with HORIBA).
- Laser wavelength selection in Raman spectroscopy – Mike Hardy and Hin On Martin Chu, Analyst, 2025.
- Comparing polarized Raman spectroscopy and birefringence in printed polycarbonate – Hassan and colleagues, 2021, National Institute of Standards and Technology publication archive.
- Interference effects in the Raman scattering intensity from thin films — Ramsteiner, Wild and Wagner, Applied Optics, 1989; public abstract.
- Evaluating a Multilayer Polymer Film by Raman Microscopy – Fran Adar, Spectroscopy, 2024; author affiliated with HORIBA.
- Raman Techniques: Fundamentals and Frontiers — Jones and colleagues, 2019.
- Time-gated Raman spectroscopy of recovered plastics – Kotula and colleagues, 2022, National Institute of Standards and Technology publication record.
- US12339165B2: Methods and devices for standoff differential Raman spectroscopy – Pendar patent disclosure, 2025.
- Errors and Mistakes to Avoid when Analyzing Raman Spectra – Ryabchykov and colleagues, Spectroscopy, 2022.