Get in touch with Tengyang Company

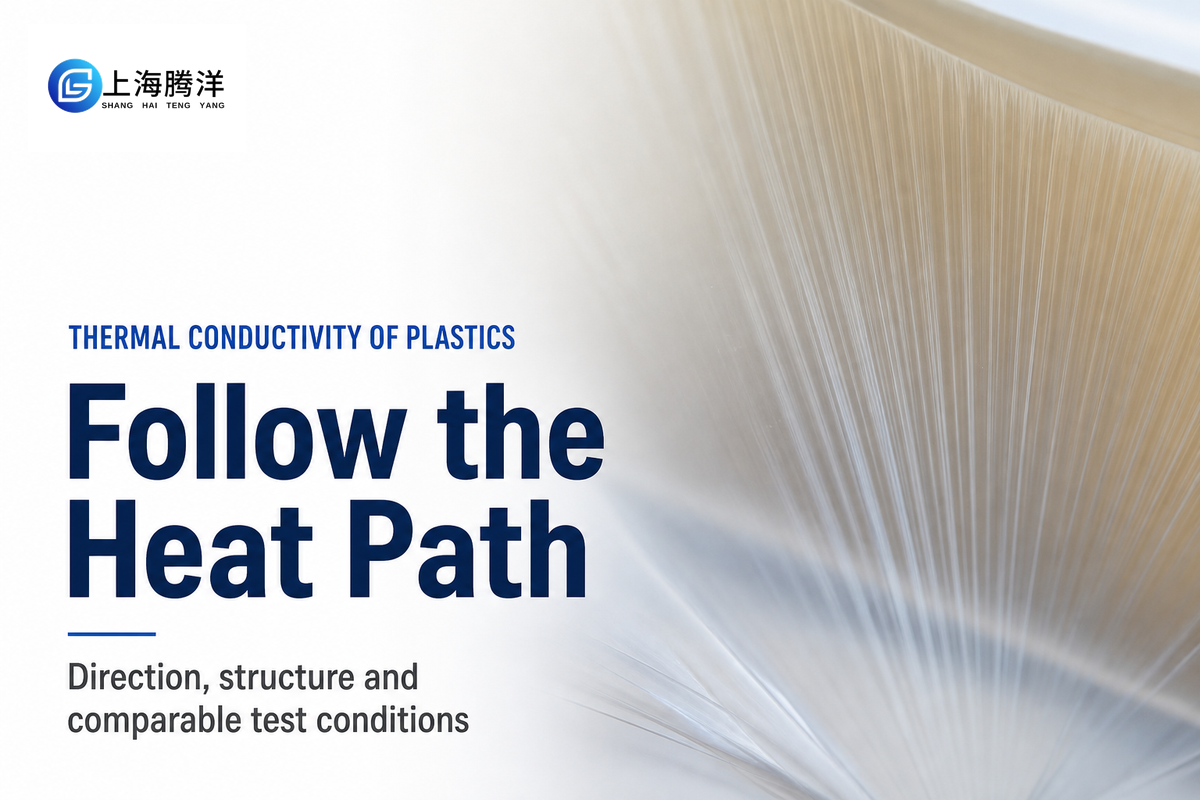
Plastics’ thermal conductivity depends on more than just the name of the resin. Other factors including chain orientation, fillers, pores and test temperature can also impact the result. When considering a film, heat can travel differently along the sheet than across the thickness. When comparing thermal conductivity values, make sure to also consider the paths the heat takes.
Updated October 2026
Thermal conductivity of plastics describes heat conduction under stated material and test conditions. Report it in W/(m·K), with direction and temperature. A material value alone doesn’t specify the thermal resistance of a bonded assembly.
Quick reference
- For high thermal conductivity, orientation counts alongside crystallinity: misaligned and amorphous regions can limit transport even in a highly crystalline polymer.
- Conductivity k: W/(m·K). Diffusivity α: m²/s. They describe different thermal properties.
- Film directions: machine direction, transverse direction and through-thickness direction.
- Layer resistance needs thickness and area; assembled resistance also includes interfaces.
- A useful test request identifies the specimen and heat path before choosing a method.
Why polymer structure changes heat flow
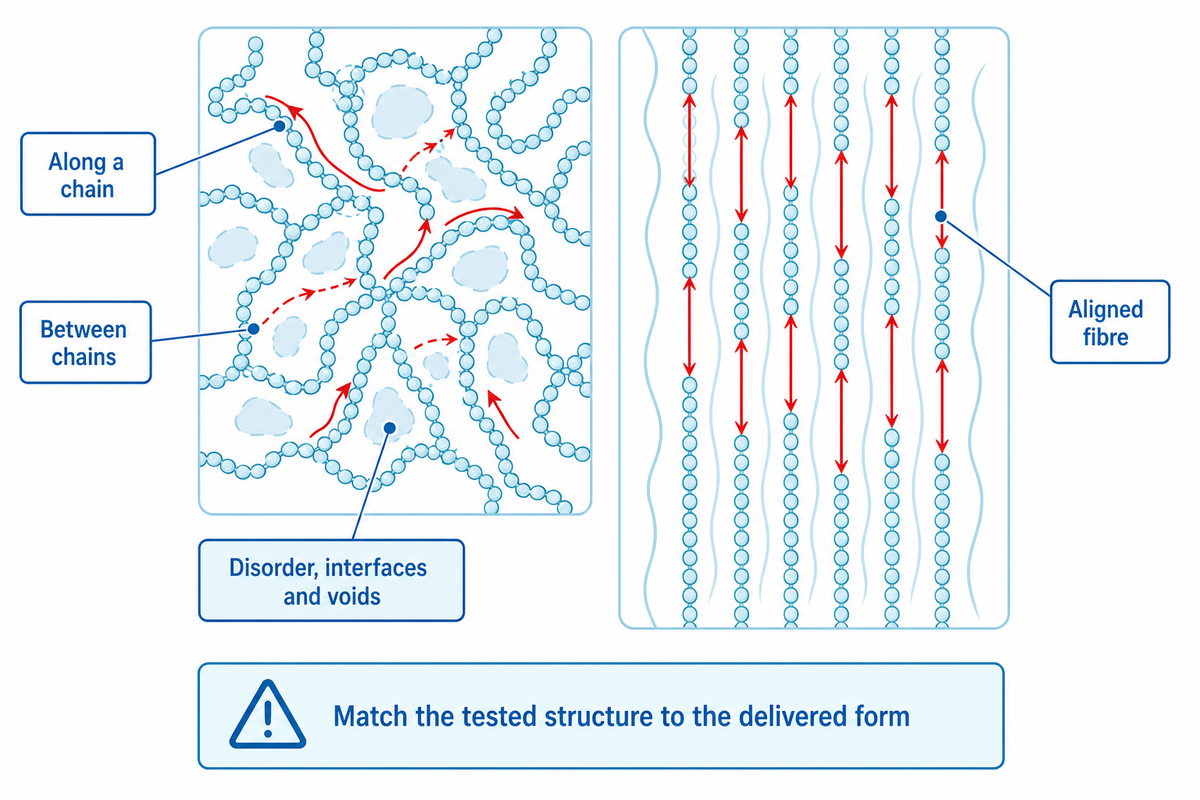
Vibrational energy can travel differently through a material depending on the structure of the polymer. Strong covalent bonds along a chain provide a different route from weaker inter-chain interactions. Disorder, interfaces, and voids can also affect energy transport. Consequently, a specially aligned fibre and an ordinary molded part can have very different thermal conductivities despite sharing a polymer family.
Why is plastic a poor thermal conductor?
Ordinary, unfilled plastic is usually a poor thermal conductor due to disordered molecular structure, which makes efficient transport of heat through the material difficult. Compared to metals, it usually doesn’t have a large mobile-electron contribution to heat conduction. Energy still moves through the material through vibrations of the molecules, but polymer chains and weak interaction between chains limit how far the vibration can transport heat.
That explanation has its limits. An electrically conductive composite is possible, and some engineered polymers conduct heat well without becoming metal. The MIT NanoEngineering Group describes ordinary bulk-polymer values around 0.1–0.3 W/(m·K), then reports measured values near 104 W/(m·K) for highly drawn ultra-high molecular weight polyethylene nanofibres. The latter is a research specimen, and not the value for standard polyethylene sheet or film.
The 2021 review by Wei and colleagues explains how mis-aligned and amorphous regions can limit transport, and thus high crystallinity alone doesn’t guarantee higher thermal conductivity. Our guide to crystallinity in polymers and measurement limits explains what a crystallinity result can and can’t establish.
For material selection, ask whether the tested structure resembles the delivered form. Are the materials presented identical to the samples evaluated? If a purchasing comparison relies on the MIT value of approximately 104 W/(m·K), the right question is whether the supplied material exhibits that structure and measurement direction. A family name is of no help.
In-plane versus through-plane: read the direction first
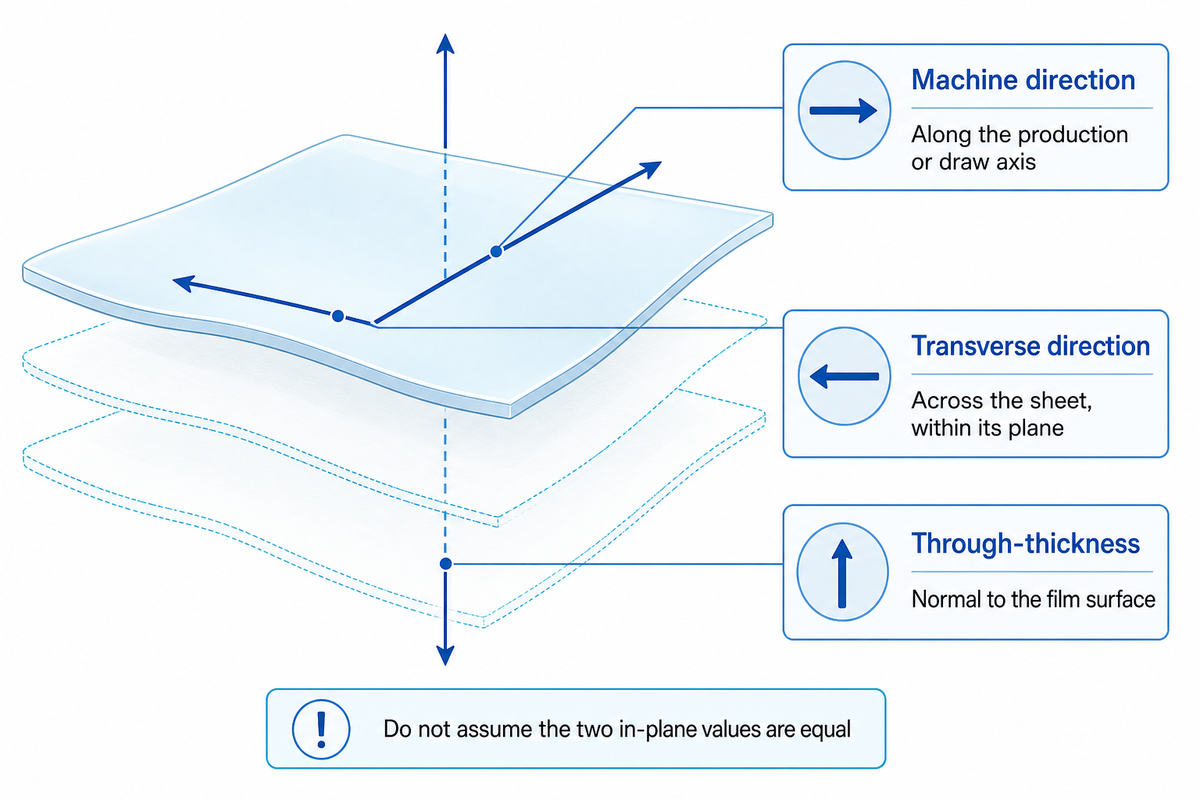
Of importance is the understanding that in-plane conductivity is concerned with heat flow along a film, while through-plane conductivity is concerned with heat flow across the thickness of a film. An anisotropic film can be different across two in-plane axes. Therefore, a result labeled “in-plane” can be incomplete. Be sure to identify the direction of the manufacturing axis on a specimen and match each reported value to the intended heat flow path.
3-Axis Heat-Path Match
3-Axis Heat-Path Match is a worksheet to compare reported values to the intended heat flow path.
| Reported result | Physical meaning | Comparison action | Limit |
|---|---|---|---|
| Machine direction, kMD | Along the production or draw axis | Align the test arrow with the roll direction | Does not describe heat crossing the film |
| Transverse direction, kTD | Across the sheet, within its plane | Check whether it was measured separately | Must not be assumed equal to kMD |
| Through-thickness, kz | Normal to the film surface | Use for the ideal bulk term of a thickness-crossing path | Does not include every assembly interface |
| Isotropic scalar k | Direction-independent within the stated model | Ask how isotropy was justified for this specimen | A polymer name is insufficient justification |
| Supported-film result | Film measured with a substrate or auxiliary layer | Identify fitted and fixed layer properties | Do not relabel an effective stack value as intrinsic film k |
| Laminate effective k | Response of the tested multilayer structure | Match layer order, thickness and heat direction | Not a property of each constituent layer |
A 2025 technical article by Candadai and colleagues reviews separate orthogonal in-plane measurements for heat spreading materials. In the context of a hypothetical sample preparation trial, consider rotating a film sample 90°. The distinction matters in a hypothetical plant trial: rotating a film sample by 90° changes the tested axis, even though the material label and thickness stay the same. A plant engineer should retain an orientation mark through sample preparation and submission, rather than ask the lab to infer the mark.
Fabrication history belongs beside the direction label. In Donovan and colleagues’ 2020 polypropylene-film study, in-plane alignment increased thermal anisotropy, but subsequent strain in the orthogonal direction reduced that increase. A result from a uniaxially drawn specimen can’t simply describe a biaxially processed film.
For a 100 µm film, an assumed thickness measurement says nothing about the ratio between its three thermal conductivities. Report the 100 µm geometry and the tested axis separately. If the supplier supplies only kMD for a thickness-crossing application, request kz or an appropriate stack measurement before calculating the heat path.
Compare plastic grades under matching conditions
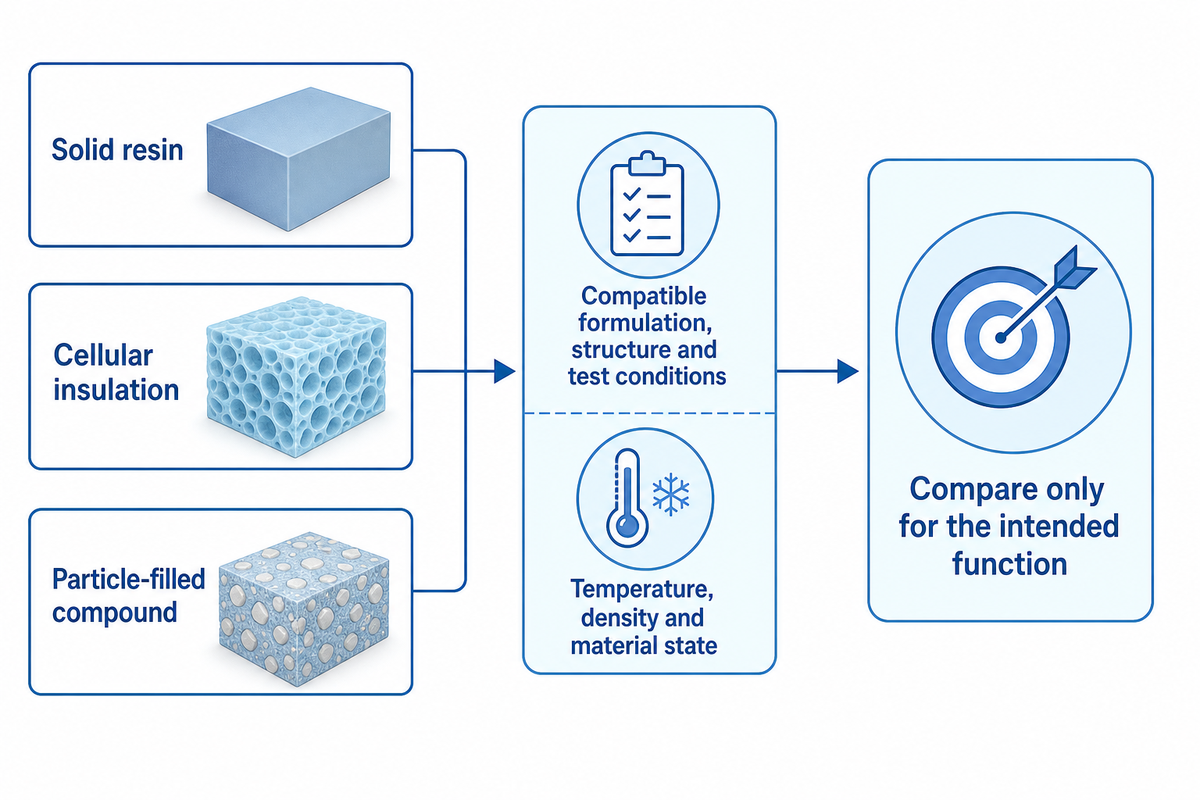
The grades in plastic can be compared only if they pertain to compatible formulations, structures and test conditions. A solid resin, closed cellular insulation and a particle-filled compound can all have the same broad chemical composition but serve different purposes. Denote test conditions and specimen form, and then determine if the comparison pertains to the engineering question at hand.
What is the thermal conductivity of PVC?
Engineering ToolBox lists PVC at 0.19 W/(m·K), a generic reference value rather than a figure for every grade. Request data for the specific formulation, physical form and temperature. For rigid, plasticized, and foamed products, justification is required separately. A generic PVC number without the aforementioned information is a preliminary reference at most, and CPVC shouldn’t be considered interchangeable with PVC grades.
When a datasheet omits direction or test method, the underlying report should be requested prior to comparing it to a plastic. The same attitude is applicable to PA6 nylon and HDPE. The same discipline applies to PA6 nylon and HDPE: a familiar family name doesn’t identify filler loading, moisture conditioning or processing history. Chemical resistance and mechanical properties should be assessed individually; a useful thermal result doesn’t corroborate either.
The difference between material and structure is visible in a 2020 study of printed PA12 cellular insulation. Its abstract reports 0.0591 W/(m·K) for selected 10 mm single-layer cell geometries at 180 kg/m³, heated from above, but the density table assigns that density to ten layers; reconcile these descriptions before reusing this combination. Air spaces and architecture are part of that effective thermal conductivity. Assigning the result to solid PA12 would discard the features the experiment actually tested.
A more tightly defined comparison appears in the National Institute of Standards and Technology’s 2026 SRM 1453a study. Its expanded-polystyrene-board equation applies over 43–53 kg/m³ and 282–314 K. The stated expanded uncertainty is 1.9%, with a coverage factor of approximately 2. Those boundaries belong to that reference material; they aren’t a blanket accuracy claim for foam testing.
A quality engineer who’s evaluating two boards can cite these values as an example of what’s to be reported: density, and mean temperature. Maybe thermal insulation prefers lower thermal conductivity, while heat dissipation prefers the opposite. When the smallest numbers are compared first, the purpose of the part is lost.
From diffusivity to conductivity without mixing conditions
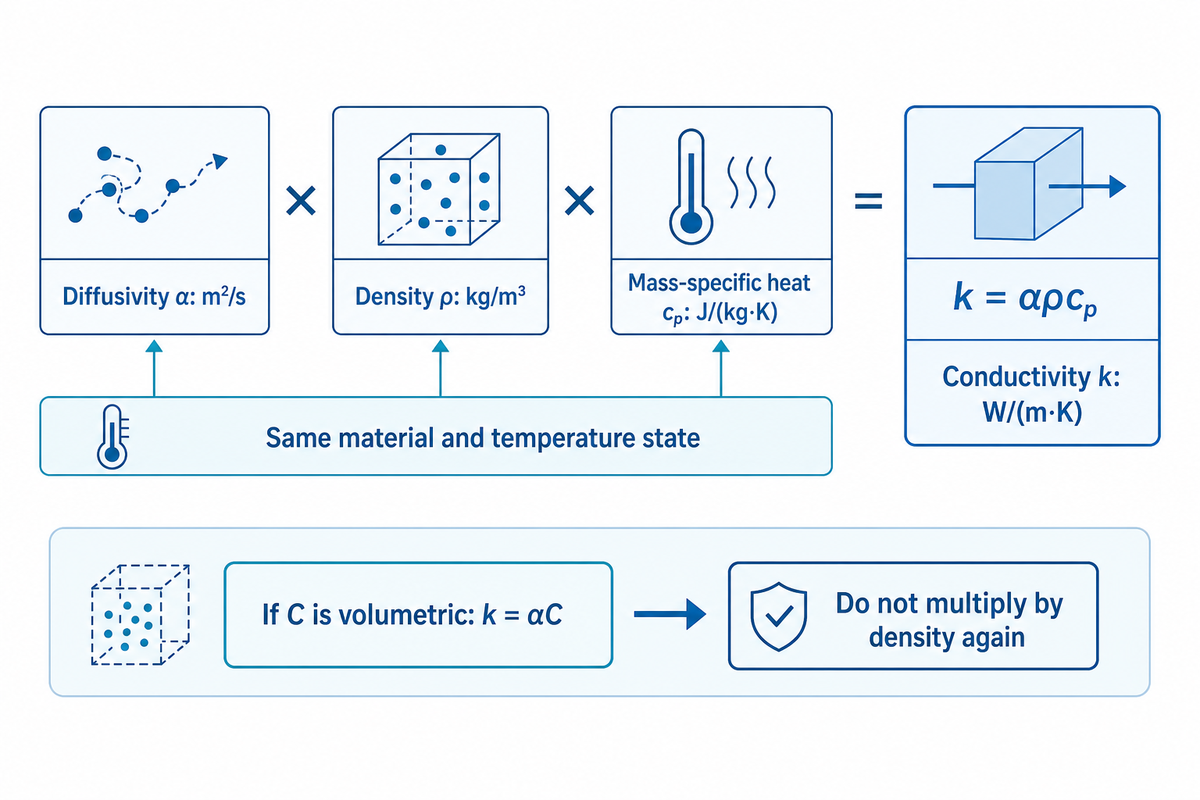
Thermal conductivity and thermal diffusivity answer different questions. Conductivity correlates to heat flux with a temperature gradient; diffusivity correlates to thermal transport with heat storage. Convert diffusivity to conductivity only with comparable density and specific heat capacity. A liquid-state heat capacity and a solid-state diffusivity don’t describe the same material condition.
How to calculate the thermal conductivity of a material?
Calculate thermal conductivity from compatible diffusivity, density and mass-specific heat capacity using k = αρcp. Express α in m²/s, ρ in kg/m³, and cp in J/(kg·K). The result is in W/(m·K). The inputs must be for the same material and temperature state, and an appropriate directional model must be considered for an anisotropic specimen.
For an illustrative specimen at 25 °C, assume α = 0.12 mm²/s, ρ = 1,200 kg/m³ and cp = 1,500 J/(kg·K). Convert α to 1.2 × 10⁻⁷ m²/s. Then k = 1.2 × 10−7 × 1,200 × 1,500 = 0.216 W/(m·K). These are assumed inputs for arithmetic, not measured Teng Yang product data.
The public scope of ISO 22007-2:2022 relates volumetric heat capacity C to ρcp and k/α. If a report already gives C in J/(m³·K), calculate k = αC. Multiplying by density again would count it twice. A value in mm²/s also needs conversion before it is combined with metre-based units.
Pause the calculation when input conditions are missing. A procurement analyst should request the density and heat-capacity basis if a laboratory reports only diffusivity, rather than insert unrelated handbook values to complete a spreadsheet. The DSC heat-capacity measurement guide explains the role of the baseline and reference measurements and the associated cp input.
Different methods need not disagree. Rides and colleagues’ 2009 intercomparison found approximately ±10% agreement for two PMMA materials across several methods. That’s a bounded study result, not a promise of ±10% accuracy for every instrument. Use uncertainty and specimen conditions to judge a difference before blaming the test method.
What a usable thermal test report must contain
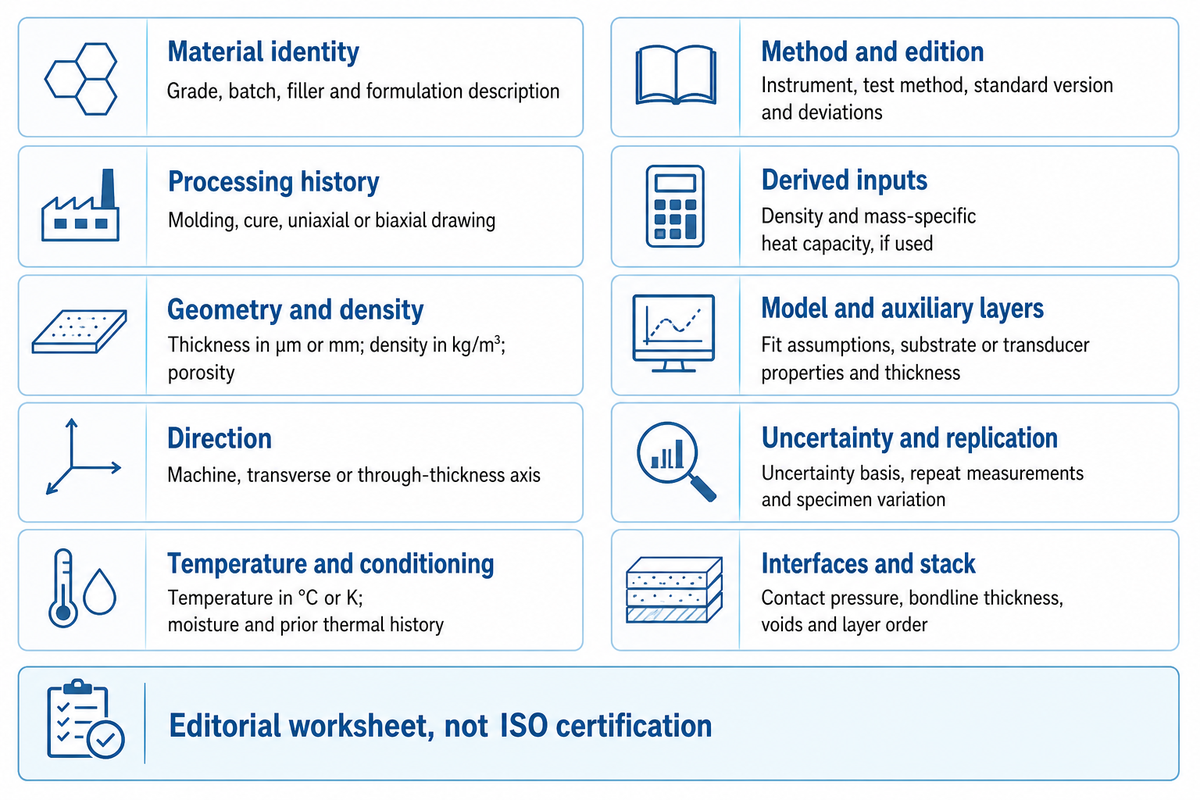
The report for thermal conductivity measurements correlates the specified measurement to the sample, direction, temperature and the measurement model. This allows an evaluating engineer to decide if the result is applicable to a proposed heat path. Beyond a completed form, review the calibration, assumptions and uncertainties behind the result.
Thermal Data Passport
The Thermal Data Passport is an editorial worksheet for recording the conditions needed to interpret and compare a polymer thermal result.
| Field | Record | Action if missing |
|---|---|---|
| Material identity | Grade, batch, filler and formulation description | Do not compare family names alone |
| Processing history | Molding, cure, uniaxial or biaxial drawing | Check whether the sample represents production |
| Geometry and density | Thickness in µm or mm; density in kg/m³; porosity | Separate solid material from effective cellular results |
| Direction | Machine, transverse or through-thickness axis | Request a specimen-axis sketch |
| Temperature and conditioning | Temperature in °C or K; moisture and prior thermal history | Align conditions before ranking |
| Method and edition | Instrument, test method, standard version and deviations | Check the actual method scope |
| Derived inputs | Density and mass-specific heat capacity, if used | Confirm units and matching material state |
| Model and auxiliary layers | Fit assumptions, substrate or transducer properties and thickness | Ask which values were fixed and which were fitted |
| Uncertainty and replication | Uncertainty basis, repeat measurements and specimen variation | Do not confuse repeatability with total uncertainty |
| Interfaces and stack | Contact pressure, bondline thickness, voids and layer order | Separate material k from assembly resistance |
ISO 22007-1:2024 provides general principles, while technique-specific standards describe the methods. ISO 22007-2 covers the transient plane source approach, often associated with a TPS sensor, under defined homogeneity and anisotropy conditions. Merely writing “ISO tested” does not identify the method or demonstrate that a multilayer specimen meets its assumptions.
Measurements of thin films can depend strongly on the analysis inputs. The NIST thermoreflectance instrumentation guidance describes fitting a multilayer thermal model, with transducer thickness and thermal properties among its inputs. Ask how the laboratory determined those values and incorporated their uncertainty into the measured result for the fitted films. This isn’t a case that all conductivity measurements are invalid.
For a hypothetical 80 °C application, comparing thermal conductivities measured only at 25 °C leaves a temperature gap. Agree with the laboratory on the needed temperature points and specimen stability before ordering the test. A high temperature request must remain within the material’s usable state as well as the instrument’s range; the two limits are usually different.
What an adhesive layer changes in the heat path
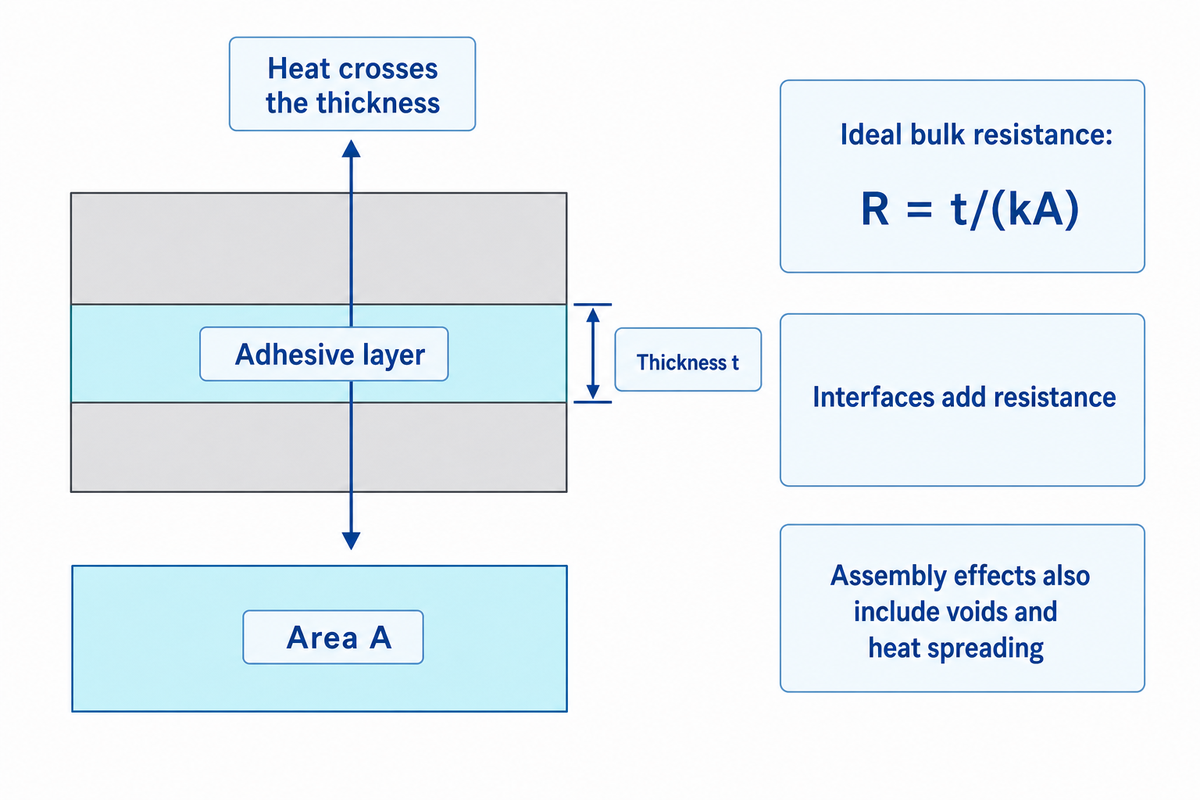
An adhesive layer adds resistance through its thickness and interfaces. For a uniform layer under steady one-dimensional heat flow, the ideal bulk term is R = t/(kA). Other factors associated with an assembled joint, e.g. contact resistance, voids, and heat spreading, can lead to non-uniformity across the joint. Thus, bulk conductivity by itself can’t determine the temperature drop across a joint.
Use an illustrative 100 µm layer with through-plane k = 0.2 W/(m·K). Its area-normalized resistance is R″ = t/k = 0.0001/0.2 = 0.0005 m²·K/W. Over 0.001 m², that’s R = 0.5 K/W. A 2 W heat flow would produce a 1 K temperature difference across the ideal layer, before additional interface or spreading effects.
Doubling the assumed thickness to 200 µm increases the bulk term to 0.001 m²·K/W at an unchanged k. This doesn’t mean the thinnest possible bondline is always the best assembly. Wetting, surface roughness, and void filling can also affect interfaces. A plant trial should examine the finished bondline, rather than substitute the supplied film’s nominal thickness without checking it.
ASTM D5470-17(2024) describes measured thermal impedance and calculates apparent conductivity for thermally conductive electrical insulation materials. Its public description explains how multiple thicknesses can separate the bulk slope from the contact contribution. Idealized parallel heat flow conditions may not always represent an actual assembly.
Do
- Compare the final bondline thickness.
- Identify contact pressure and surface preparation.
- Request a relevant stack measurement when interfaces dominate.
Don’t
- Assign filler conductivity to the finished adhesive.
- Use an in-plane number for thickness-crossing heat.
- Treat every bonding film as a qualified thermal interface material.
A hot melt adhesive film can serve as a bonding layer in the discussed assembly. The suitability of the film for thermal performance requires assembly and grade-specific evidence; the product category alone supplies no thermal rating. For interpreting those supporting records, the adhesive test interpretation guide explains how to keep a test result tied to its actual acceptance question.
Fillers, orientation and current research
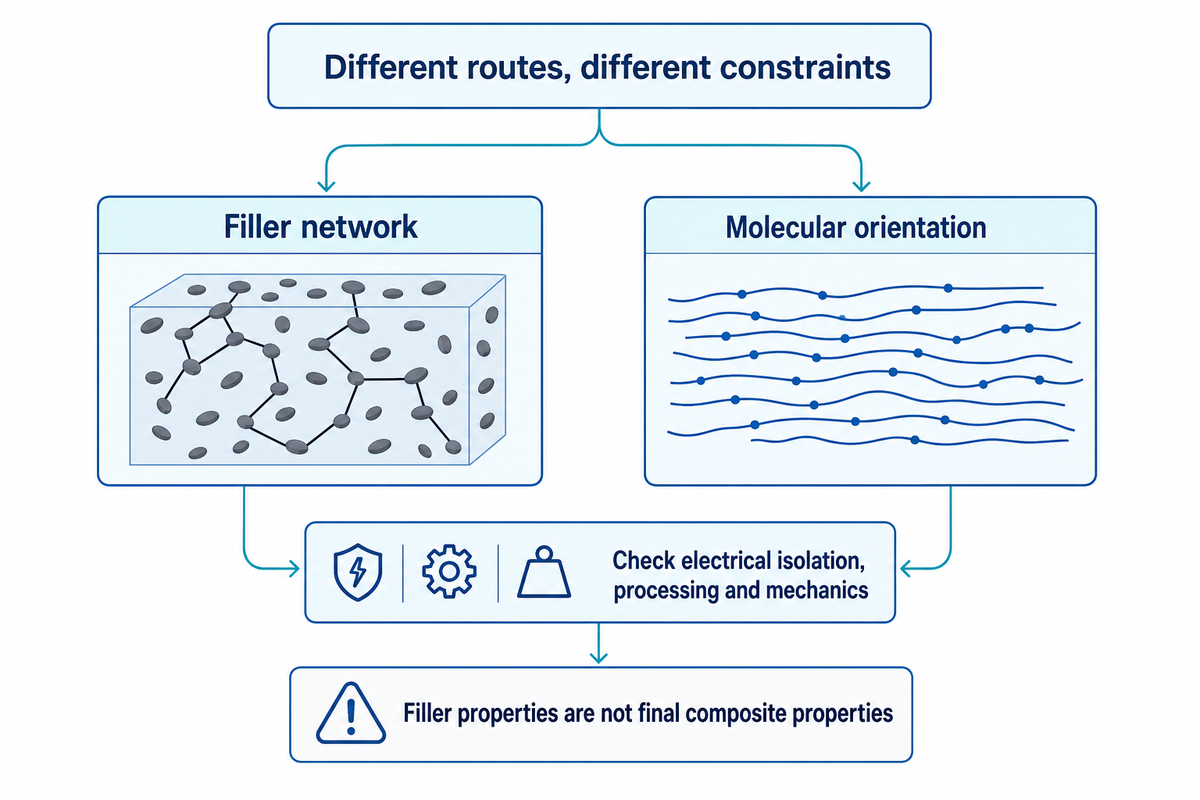
Thermally conductive plastics may be achieved by the formation of a network of fillers, or by the orientation of molecules in certain directions. These routes create different restraints. An electrically insulating heat path, a compliant interface and a moldable component may require different formulations. Before deciding that the compound with the highest published thermal conductivity is the right compound, specify the function of the material.
Conductive fillers can improve the thermal conductivity of polymer composites, but their loading, shape and interfaces affect the outcome. Aluminum nitride and other ceramics provide different electrical and thermal behavior from metal particles. Graphite or a carbon nanotube network may support heat transport, but electrical conductivity must be controlled for. The thermal properties of carbon fillers aren’t the properties of the final polymer composite.
Wei and colleagues’ review describes the tradeoff: excessive filler can stiffen a thermal interface material and impair its ability to conform to surfaces. Powder conductivity can’t be taken directly to a thermally conductive polymer specification. For battery housings and other high performance applications, thermal management also includes electrical isolation, processing and mechanical requirements. A compound used to improve the thermal path still needs evidence for those other functions.
Orientation research offers another route. A 2026 Advanced Materials study of largely amorphous olefin block copolymer fibres investigates strain-tunable heat transport. The MIT report on that work attributes the result to a particular fibre and stretching process. Researcher Duo Xu explains the structural distinction:
“Our material is always in a mostly amorphous state; it never crystallizes under strain”
The lesson learned is to see which mechanism accounts for the increase in conductivity and whether it’s retained in the final product. Just because a process simulation is based on an isotropic resin, it can’t always represent a strongly oriented film. Thermoplastic processing and subsequent stretching can alter the structure that the simulation needs to describe.
Recent patents also require attribution. The published record for WO2026014459A1 dated January 2026, lists Mitsubishi Gas Chemical as assignee and describes boron nitride particle aggregates. An application isn’t a measured performance guarantee, a granted claim of exclusivity, or Teng Yang research. Neither the patent nor the MIT study proves the thermal properties of a Teng Yang product.
Questions to resolve before commissioning a test
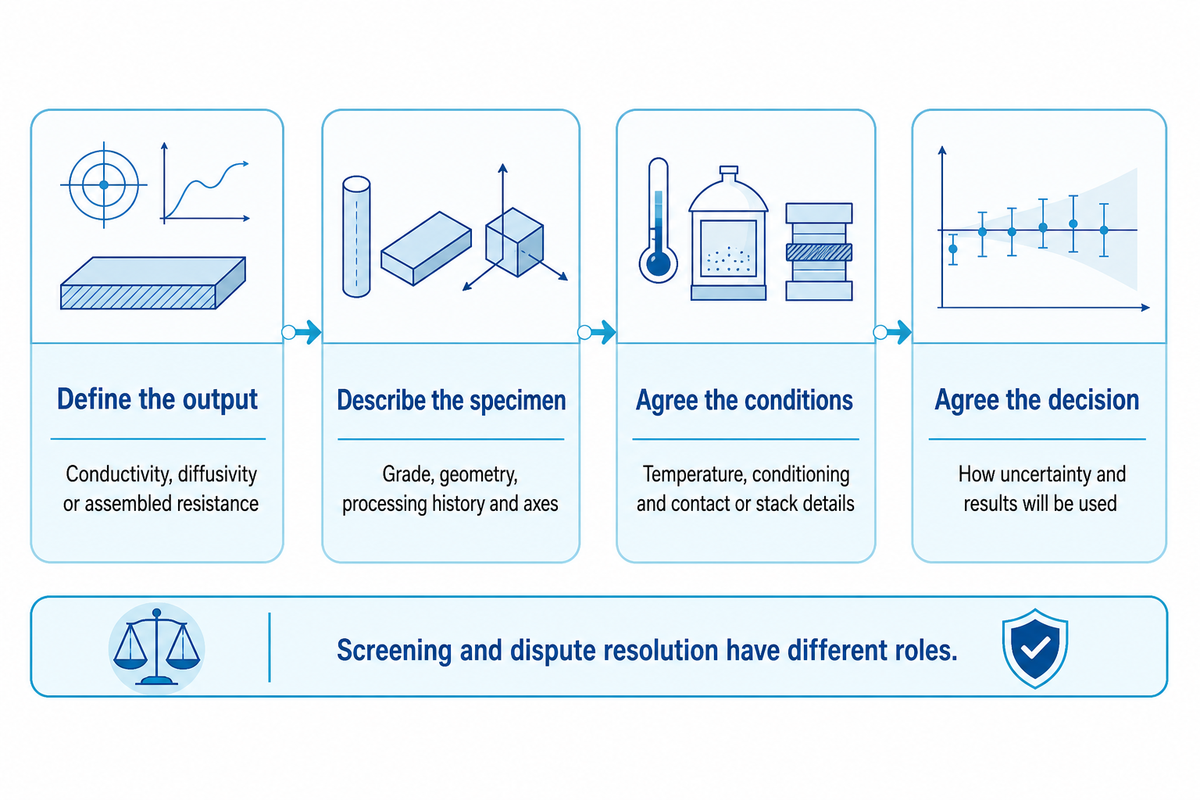
A request for a thermal test should specify the quantity and describe the physical form of the specimen as well as the direction of heat flow. Agree with the laboratory on the scope of the method and its acceptance criteria. Different methods may be appropriate for different types of materials. A screening test and a dispute-resolution test need not have the same evidential role.
ISO 22007-4:2024 describes light-flash measurement of thickness-direction thermal diffusivity in thin solid plastic discs. Therefore, a laser flash result should not be interpreted as a direct measurement of conductivity. Its public scope also notes that inhomogeneous specimens can give thickness-dependent results. For supported films, establish whether the requested output is a fitted film property or an effective stack response.
The public description of the current ASTM D5930-26 line-source method covers filled and unfilled thermoplastics, thermosets, and rubbers. The public description of the method states that it cannot be used as a referee method in a dispute, because it does not contain a statement regarding numerical precision and bias. This may be important when the method result will decide supplier acceptance, even if the method may be useful for other work.
- Define the output. Request conductivity, diffusivity or assembled resistance with the intended units.
- Describe the specimen. Include its grade, geometry, processing history and marked axes.
- Agree the conditions. Set temperature, conditioning and relevant contact or stack details.
- Agree the decision. State how uncertainty and the result will be used before testing starts.
For many applications, those four steps prevent a useful laboratory measurement from answering the wrong question. More general polymer physics for bonding connects the heat path with time and load. When a report crosses a transition, also distinguish glass transition from the melting point before treating its thermophysical data as if it were a single, continuous material state.
Frequently asked questions
What is the thermal resistance of plastic?
Thermal resistance depends on geometry as well as conductivity.
For a uniform layer, R = t/(kA) gives resistance in K/W under steady one-dimensional heat flow. Area-normalized resistance is R″ = t/k in m²·K/W. Actual components may add contacts, voids and heat spreading. State whether the reported resistance describes a material layer, a tested stack or a complete component before using it in a heat-transfer calculation.
Is 0.033 W/(m·K) a good thermal conductivity?
Yes for thermal insulation: 0.033 W/(m·K) is close to the 0.03 W/(m·K) listed for expanded polystyrene, while for heat spreading it is a poor value.
Whether it’s useful depends on the intended function and the material’s verified test conditions. An insulating component and a heat-spreading component pursue different outcomes. Check temperature, density, moisture state and measurement method. Don’t assume that this hypothetical value describes a solid plastic, a particular commercial grade or every specimen made from the same resin.
What is the best test method for polymer thermal conductivity?
Match the method to the specimen: light flash suits thin solid plastic discs, a transient plane source suits homogeneous samples, and a steady-state stack test suits bonded layers.
Choose with the laboratory after defining form, thickness, direction, temperature and expected property range. A transient plane source measurement, flash diffusivity test and steady-state resistance test have different assumptions. Some methods fit a model or derive conductivity from other inputs. Ask how those inputs and uncertainty will be reported, and whether the method is suitable for the intended acceptance decision.
What is the difference between thermal conductance and conductivity?
Conductivity is a material property under stated conditions; conductance includes geometry.
For the ideal uniform layer, conductance is kA/t in W/K. The illustrative 0.5 K/W layer has conductance 1/0.5 = 2 W/K. Changing its dimensions changes conductance without necessarily changing conductivity.
Which plastic has the lowest thermal conductivity?
Among common plastics, foams rank lowest: Engineering ToolBox lists expanded polystyrene at 0.03 W/(m·K), well below solid grades, so rank foams and solid resins separately.
A ranking changes when it mixes solid resins with foams, aerogels or printed cellular objects. In porous materials, gas spaces and architecture contribute to the effective result. Moisture, temperature and density also need to be attached to the number. Comparing a low-density insulation board with a dense engineering part would answer a different question from comparing two solid grades.
Start by defining the application and acceptable physical form. For thermal insulation, compare documented products under matching conditions and include their mechanical and environmental requirements. For a bonded part, examine the full heat path rather than select a resin solely because its conductivity is low. Plastics can be formulated for different functions, so the useful shortlist contains materials that meet the complete requirement. Compare their thermal results only after checking those other conditions, then identify the evidence still needed for the final part.
About the evidence: This guide synthesizes publicly available standards summaries and attributed research, and provides working examples. The Thermal Data Passport is an editorial aid and not a technology certification checklist. No cited third-party experimental or patent literature is offered as a Teng Yang test, product specification or proprietary technology.
References & Sources
- Polymers with High Thermal Conductivity, MIT NanoEngineering Group.
- Thermal Transport in Polymers: A Review, Wei and colleagues, ASME, 2021.
- Measuring the Thermal Conductivity of Anisotropic Heat Spreading Materials, Candadai and colleagues, Electronics Cooling, 2025.
- Strained Polymer Thermal Conductivity Enhancement Counteracted by Additional Off-Axis Strain, Donovan and colleagues, Macromolecules, 2020; University of Rhode Island repository.
- Thermal Conductivity of 3D-Printed Plastic Insulation Materials, Materials, 2020.
- SRM 1453a Expanded Polystyrene Board, National Institute of Standards and Technology, 2026.
- ISO 22007-2:2022, International Organization for Standardization, public scope.
- Intercomparison of Thermal Conductivity and Thermal Diffusivity Methods for Plastics, Rides and colleagues, Polymer Testing, 2009; public abstract and previews.
- ISO 22007-1:2024, International Organization for Standardization, public scope.
- Thermoreflectance Instrumentation, National Institute of Standards and Technology.
- ASTM D5470-17(2024), ASTM International, public scope and significance.
- Strain-Tunable Thermal Conductivity in Largely Amorphous Polyolefin Fibers, Advanced Materials, 2026; MIT author-manuscript record.
- A Quick Stretch Switches a Polymer’s Capacity to Transport Heat, MIT News, February 2026.
- WO2026014459A1, published international application, January 2026; Google Patents record.
- ISO 22007-4:2024, International Organization for Standardization, public scope.
- ASTM D5930-26, ASTM International, public scope and significance.