
Get in touch with Tengyang Company


Updated October 2026
A polymer strip can keep stretching with the same weight attached. If you hold the length of some other strip fixed, the force needed to hold it can decrease. Changes in what’s held constant explain creep vs stress relaxation and tell us which result is helpful in dealing with sagging, movement or loss of clamping force.
Quick comparison
Creep: hold stress, measure strain over time. Stress relaxation: hold strain, measure stress over time. Temperature and loading history belong beside either curve.
Creep vs stress relaxation compares 2 time-dependent responses: increasing strain under held stress and decreasing stress under held strain. Choose creep for deformation under sustained loading; choose relaxation for force loss at a fixed deformation.
Key points
- Creep deformation can recover after unloading; it isn’t always permanent set.
- Constant force and constant true stress differ when the specimen area changes.
- The reciprocal of creep compliance is a creep modulus, not generally the relaxation modulus at the same time.
- A bonded assembly needs the loading condition and measurement location defined together.
What is the difference between creep and stress relaxation?
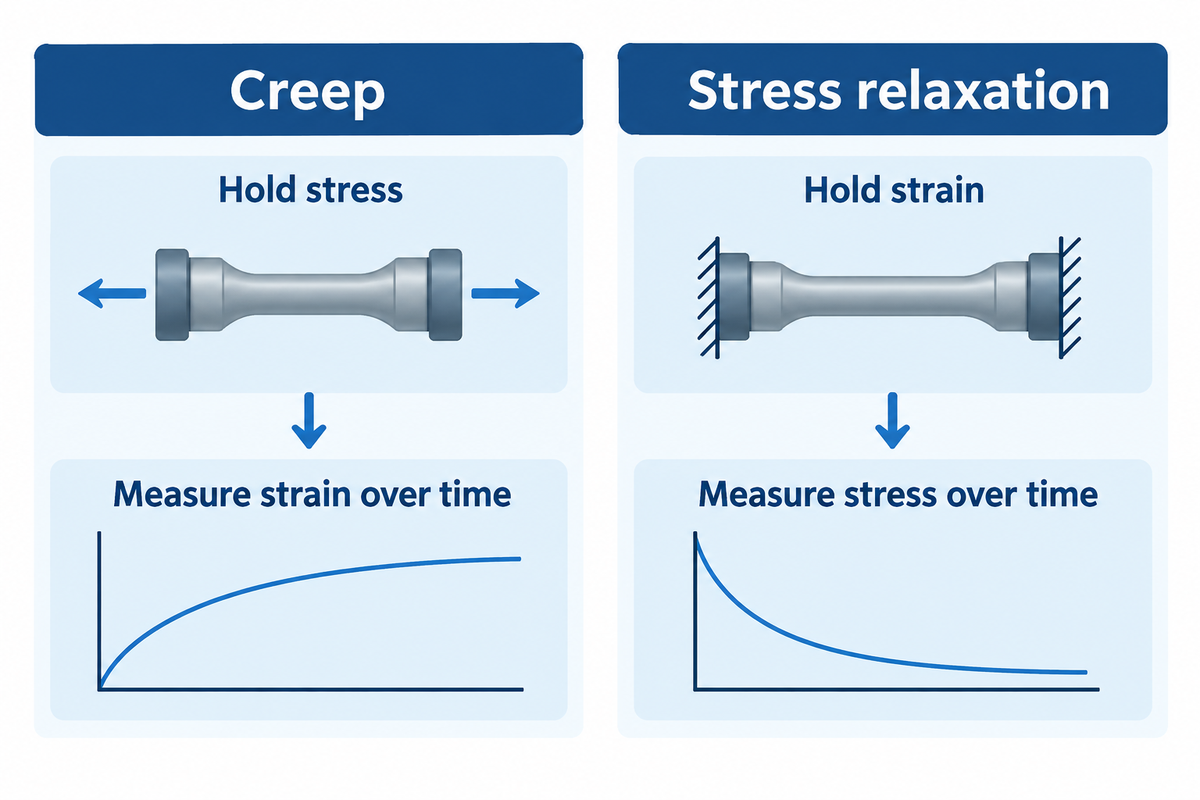
Creep considers how much a material deforms under constant stress. Stress relaxation considers how much stress remains while strain is maintained. Both describe a time-dependent behavior, but they address different questions: how far will a loaded part move or how much force will a constrained part retain?
In tensile testing, creep behavior appears as increasing creep strain during the hold. In a stress relaxation test, the recorded stress generally falls. Penn State’s polymer-property explanation separates these experiments by their controlled variable. The distinction also applies to shear and compression, so long as the stress and strain measurements match the deformation mode.
| Feature | Creep experiment | Relaxation experiment |
|---|---|---|
| Held quantity | Specified stress or nominal load | Specified specimen strain |
| Recorded response | Strain or deformation | Stress or reaction force |
| Typical time trace | Deformation increases | Holding force decreases |
| Horizontal axis | Time after loading | Time after imposing strain |
| Tensile strain unit | Dimensionless ratio or % | Held ratio or % |
| Stress unit | Pa or MPa | Pa or MPa |
| Normalized function | Creep compliance J(t) | Relaxation modulus E(t) |
| Useful endpoint | Movement at a stated time | Force remaining at a stated time |
| Separate follow-up | Unload and measure recovery | Release constraint and assess recovery |
Definitions: see Rod Lakes, Viscoelasticity Notes. Load and displacement measurements require the specimen conventions explained below.
How do load, stress, strain and displacement differ?
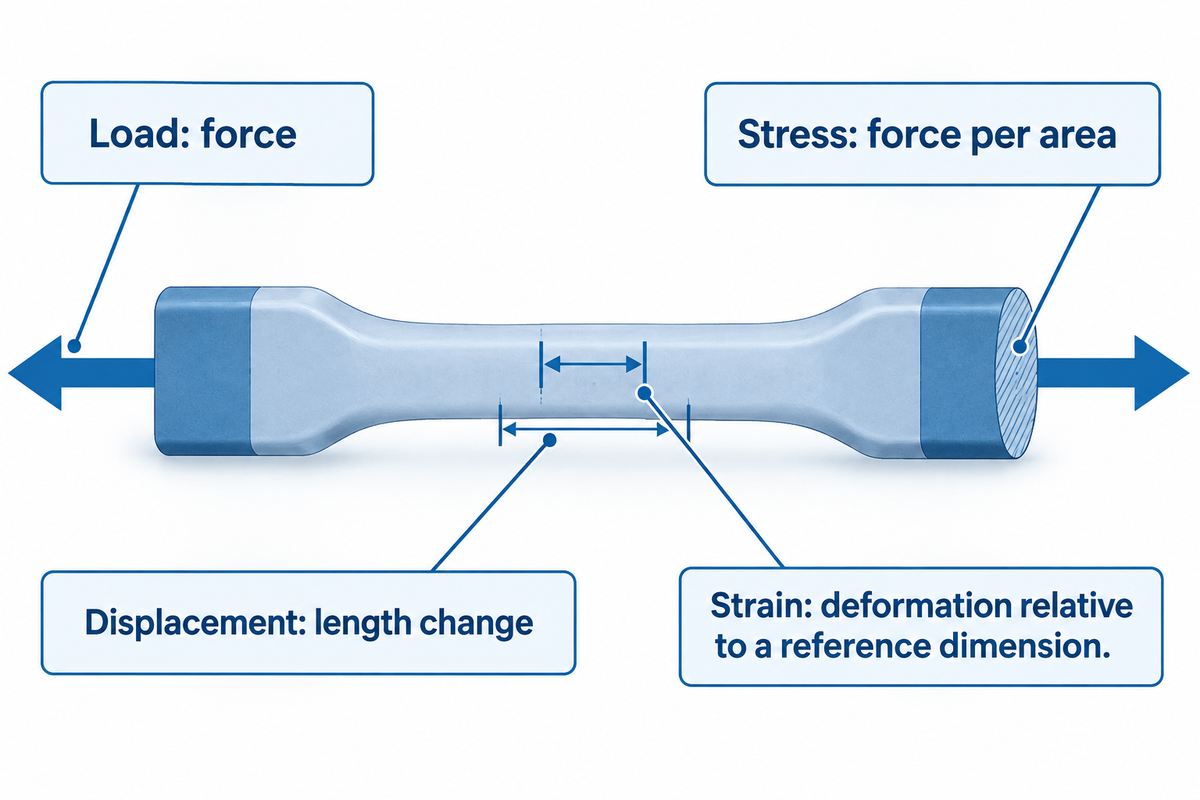
In the context of this experiment, load refers to a force, stress to a division of force by an area. Displacement means a change in length, and strain is a measure of deformation with respect to a reference dimension. In an engineering stress context, the reference area is the original cross-sectional area of the specimen. In a true stress case, the reference area is the existing cross-sectional area of the specimen. A machine holding one quantity doesn’t necessarily hold every related quantity constant.
Example: a tensile specimen carries 100 N and starts with a cross-sectional area of 10 mm². Its engineering stress is 100 ÷ 10 = 10 MPa. If its current area falls to 8 mm² while force stays unchanged, its true stress becomes 100 ÷ 8 = 12.5 MPa. Under this constant load, the current-area stress has risen. This is the area convention described in Northwestern’s materials mechanics text.
Gauge length needs the same care. An extension of 1 mm across an original 50 mm gauge length gives an engineering strain of 0.02, or 2%. Crosshead movement can include grip slip and deformation of the load frame. An extensometer or optical gauge measures a defined specimen region instead.
Nominal average shear stress from the force over the overlap area is what’s determined from a bonded lap joint. Stress concentration near the overlap ends and changes in the adherends make the local stress state more complicated. Two laboratories can therefore report different deformation behavior even with the same nominal load if they measure different parts of the assembly.
How should you read the two time curves?
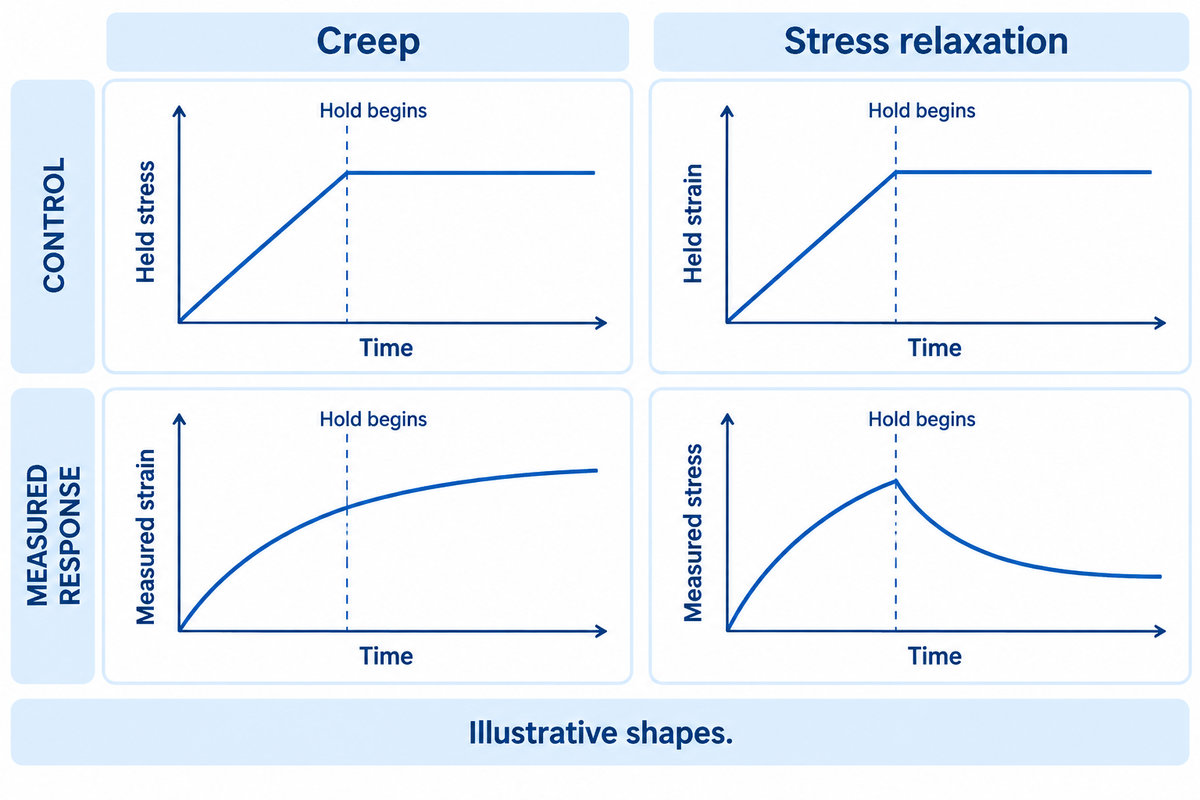
Read a creep curve as deformation against time and a stress relaxation curve as stress against time. First, locate the loading ramp and the beginning of the hold. Then check the axis scale and temperature and the measurement channel. Early instrument settling and later material response occur in different parts of the creep data.
What is the difference between a creep test and stress relaxation?
The creep test typically applies a load or stress and follows the resulting deformation during the hold. Relaxation experiments apply a deformation and follow the force needed to maintain it. The instrument therefore controls the opposite sides of the stress-strain relationship. A load-controlled creep report should specify whether the stress calculation involves the original area. A displacement-controlled test report should specify how specimen strain was maintained.
Loading is never instantaneous, so temperature and strain rate should be in the test record. A ramp that lasts 5 s and one that lasts 50 s create different early histories, even when they end at the same value. The times shown in the examples are simply illustrations and aren’t recommended settings. Also, when assessing rate dependence in the test data, the ramp shouldn’t be hidden in an unexplained zero time.
The familiar period of primary creep has a decreasing creep rate. Secondary or steady-state creep has a roughly constant rate, and tertiary creep accelerates toward rupture. These regions can occur, but every polymer curve need not display all three. Lakes also distinguishes a straight time trace from linear viscoelasticity: linearity concerns proportional stress and strain responses at corresponding times, not whether a plotted line is straight.
Logarithmic time axes spread early observations apart and compress later ones. Compare the rate of creep using the same time interval and axis convention; a visual slope on a log plot isn’t a constant strain rate.
What do compliance and relaxation modulus tell you?
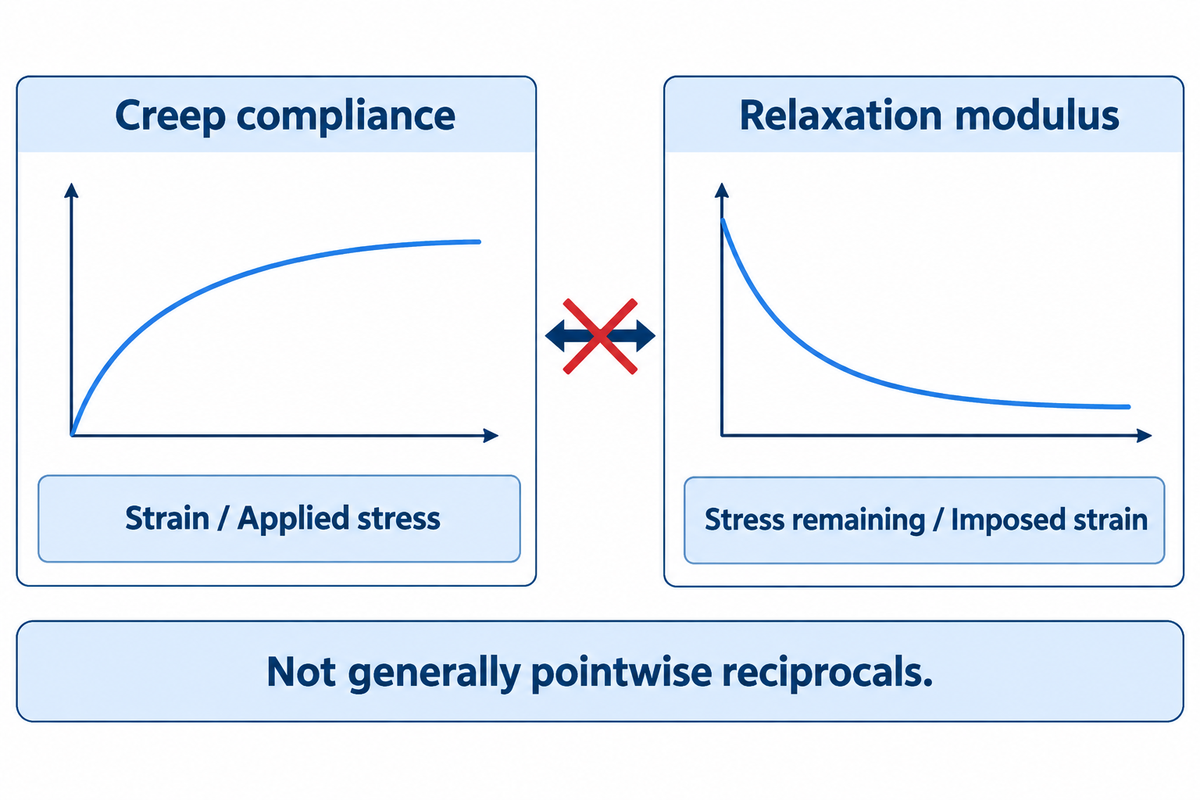
Creep compliance measures strain per unit applied stress during an ideal step-stress test. Relaxation modulus measures stress remaining per unit strain during an ideal step-strain test. Each describes stiffness in a different test. Use matching tensile, shear or volumetric functions, with the temperature and linear-response range given.
For a uniaxial test, the equations are J(t) = ε(t)/σ₀ and E(t) = σ(t)/ε₀. Compliance has inverse-stress units, e.g., MPa⁻¹; modulus has stress units, e.g., MPa. A shear relaxation function is usually written G(t) so a shear value shouldn’t be relabeled as tensile Young’s modulus.
Example: at a chosen observation time, an assumed tensile stress of 2 MPa produces strain 0.02. The creep compliance is 0.01 MPa⁻¹. Taking its reciprocal gives a creep modulus of 100 MPa. The relaxation modulus at the same observation time is not determined by that calculation.
Can creep compliance be converted into relaxation modulus?
Yes, within an appropriate linear viscoelastic model, the complete functions can be interconverted. The operation uses their hereditary relationship, usually through convolution, transforms or fitted constitutive models. It isn’t generally the equation E(t) = 1/J(t). The methods described in the 2023 study by Chen and colleagues convert asphalt data in multiple ways. Their material measurements are specific to their study.
Model choice also matters for a joint. In NPL’s report on flexible adhesive joints, finite element predictions were sensitive to initial extension and the loading rate used to obtain input properties. A numerical correlation fitted to one experiment needs comparison with the intended loading history before it’s used to simulate another test. Keep its tested strain rate range with the model parameters.
What changes after the load is removed?
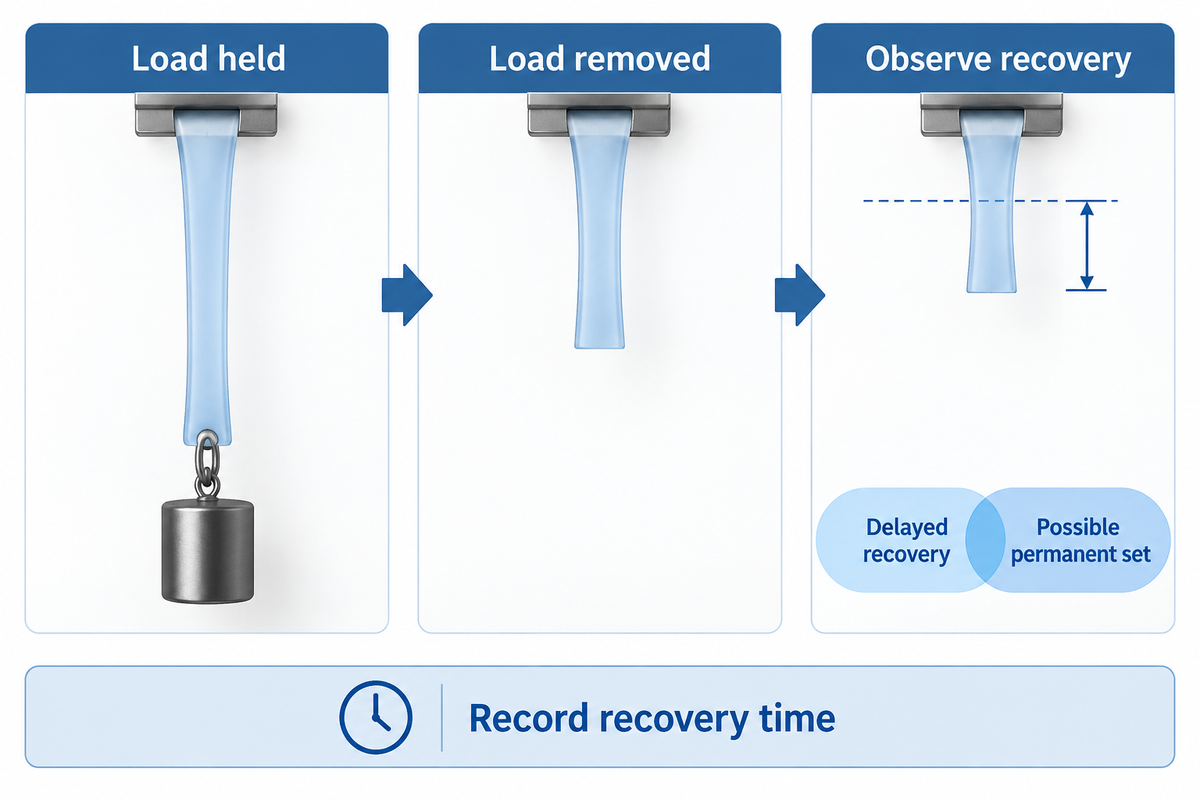
Unloading can produce immediate elastic recovery followed by slower recovery. Some materials return to their original dimensions completely; others retain plastic deformation. The amount remaining after a short waiting period can be due to delayed recovery as well as permanent plastic flow. Plasticity describes an irreversible part of deformation; delayed viscoelastic strain can recover. Record recovery time before concluding that the residual strain is permanent.
“Viscoelastic materials which exhibit complete recovery after sufficient time following creep or relaxation are called anelastic.”
A strip that remains stretched when a load is removed may continue shortening after the load is removed. Recording the first value only lumps permanent set and delayed recovery together. When stress is removed, a creep and recovery record keeps the loading, hold, unloading and recovery intervals together. Returning to the original length is a dimensional observation; interface damage needs its own assessment.
Compression set and compression force decay address different questions. Set measures residual deformation after a particular compression-and-release process. Relaxation follows force while deformation is maintained. A seal may require both measurements when dimensional recovery and retained sealing force are different design requirements.
How do time, temperature and material structure change the result?
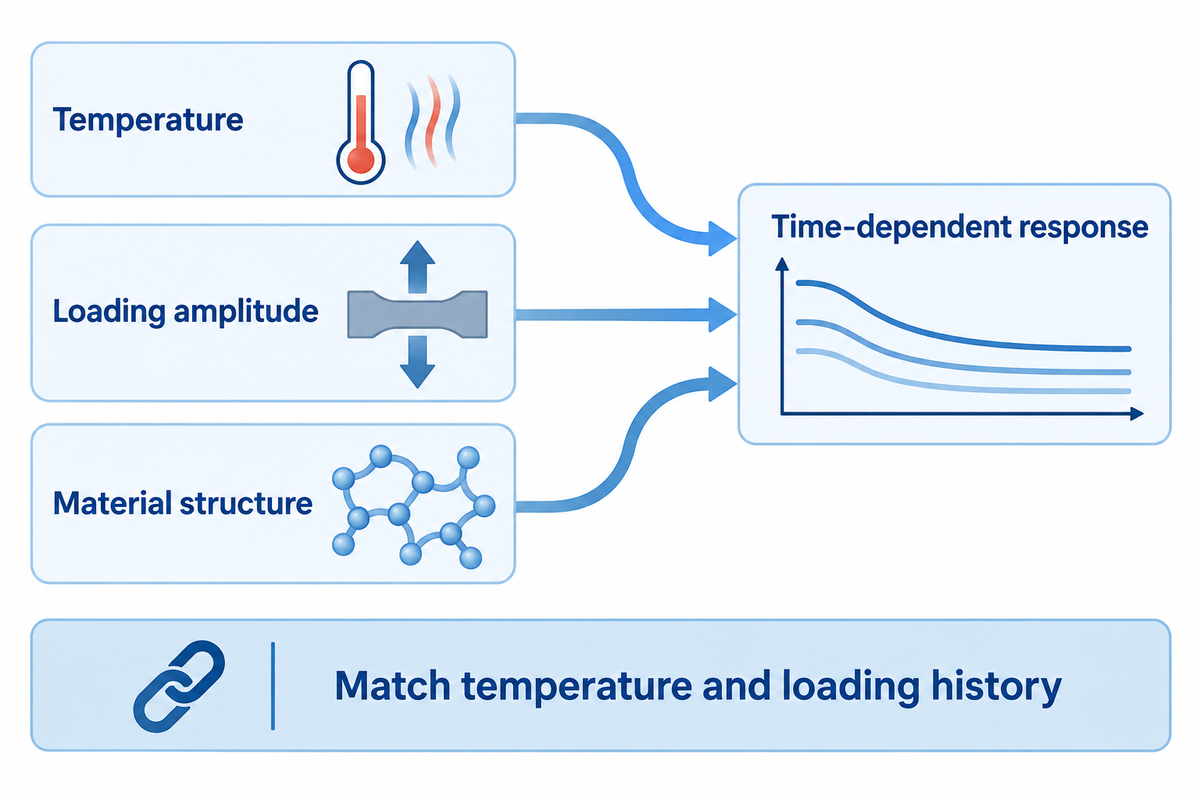
The time-dependent response of a polymer is impacted by factors such as temperature and the amplitude of loading. Its microstructure also matters, so comparisons must identify the grade and preparation history. Higher temperatures often accelerate molecular rearrangement, while a larger stress level can move the experiment outside its linear range. During material optimization, compare candidates at a given temperature and loading history before treating a difference in curves as a difference in grade quality.
TA Instruments’ PDMS application note gives a useful test-specific example. At 30 °C, creep compliance curves at 1 Pa and 100 Pa nearly overlapped, while the curve at 5 kPa began to depart. The same note reports an oscillatory critical stress around 10 kPa. Transferring the oscillatory limit directly to creep would therefore miss the earlier departure in that sample.
With regards to the relaxation experiment, that PDMS sample showed close agreement in modulus curves at 1% and 60% strain, with deviations at higher strains. Its oscillatory critical strain was about 30%. These are observations for the reported material and setup, not starting limits for every adhesive film. A material characterization program can compare normalized curves at different amplitudes to identify the applicable range.
Service life introduces additional changes. ASTM D6147-97(2026) distinguishes physical and chemical contributions to rubber force decay and warns against simple extrapolation across substantially longer times or different temperatures. Time-temperature methods require compatible material behavior across the conditions being combined.
Transitions in polymer change the interpretation of elevated-temperature results. The difference between glass transition and melting helps separate a mobility change from melting. Durability of an adhesive joint exposed to moisture is discussed in ASTM D2918, under the combined environmental exposure and peel stress. A dry deformation limit alone does not answer the question about wet service.
Which test matches a bonded assembly or polymer part?
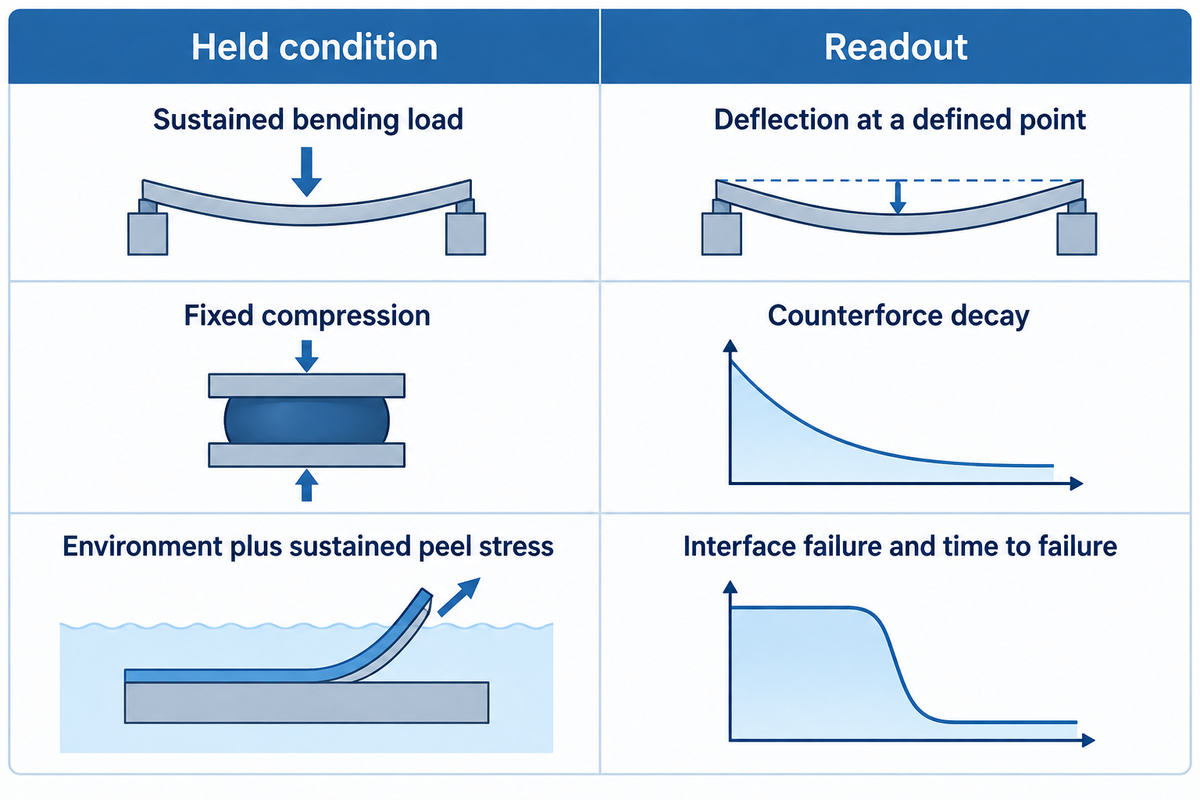
Select creep testing when the service condition maintains a load and excessive movement is the concern. Select relaxation testing when deformation is constrained and loss of reaction force is the concern. For a compliant assembly, measure both movement and force: deformation can shift between the specimen, adherends and fixture during the hold.
Hold–Read Test Selector
Hold–Read Test Selector couples the constrained quantity and the failure concern to a test response and measurement location.
| Application question | Held or imposed condition | Useful observation |
|---|---|---|
| Suspended strip stretches | Constant hanging force | Gauge extension versus time |
| Shelf gradually sags | Sustained bending load | Deflection at the defined point |
| Loaded bond shifts | Defined joint shear loading | Relative adherend movement |
| Stretched strip loses tension | Held specimen gauge strain | Reaction force versus time |
| Compressed elastomer loses force | Fixed compression | Counterforce decay |
| Clip loses retention | Installed component geometry | Retained force at the contact |
| Flexible fixture moves | Coupled assembly constraint | Both joint movement and force |
| Part stays distorted after release | Defined unload and recovery history | Residual deformation versus recovery time |
| Wet bond starts peeling | Environment plus sustained peel stress | Interface failure and time to failure |
Method basis: ASTM D2294 for metal-to-metal adhesive shear creep, ASTM D6147 for rubber/TPE compression force decay, and ASTM D2918 for stressed-joint durability. Rows represent test routes, not acceptance values for products.
Consider a film bond between two flexible sheets. A rigid machine frame doesn’t make the sheets rigid. Part of its movement can occur in the adherends, while the adhesive’s local shear stress changes along the overlap. A 2020 study of epoxy-bonded polyethylene joints found that overlap geometry affected creep elongation and that shear-stress distribution changed with testing time. The engineer therefore needs movement due to creep measured across a stated joint region, rather than treating crosshead displacement as uniform adhesive strain.
For rubber or an elastomer, compression tests can follow the counterforce route. For metal-to-metal adhesive bonds, D2294-96(2024) states a spring-loaded creep method. A high-temperature alloy component and a room-temperature polymer can share the basic control/read distinction, while needing different material models and test conditions.
What should a useful test request and report contain?
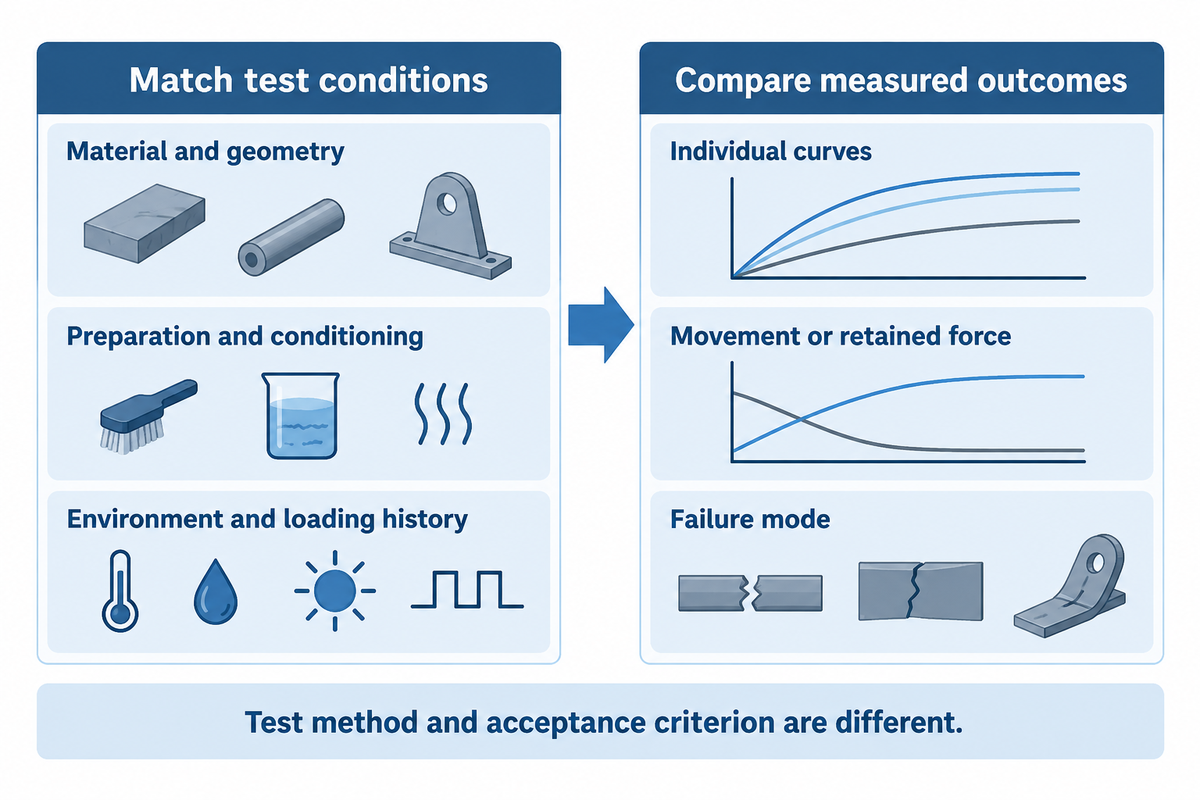
A useful request defines the specimen, environment, loading history and measured endpoint prior to testing. Compare suppliers under matched conditions, then judge each result against the application’s movement or retained-force requirement. The name of the test method identifies a procedure; the acceptance criterion defines the service goal of the part.
Assumed inputs for a non-safety-critical screening trial: a bonded strip must move no more than 0.5 mm during a 24 h hold under 10 N at 40 °C. A separate constrained-component trial starts at 100 N and requires at least 70 N after the same hold. The first criterion calls for displacement data; the second calls for retained-force data. They’re example application requirements, not material specifications.
Matched-condition test request
| Report field | Record for the trial | Decision owner |
|---|---|---|
| Material identity | Grade, lot and adhesive form | Procurement matches the supplied material |
| Specimen geometry | Thickness, overlap and gauge dimensions | Engineering matches the application |
| Bond preparation | Substrates, surface preparation and bonding cycle | Production reproduces the joint |
| Conditioning | Storage and moisture exposure before loading | Quality compares like-conditioned samples |
| Environment | Actual specimen temperature and humidity history | Engineering defines the exposure |
| Loading ramp | Rate, duration and start of the hold | Laboratory preserves the time origin |
| Control and measurement | Force or strain channel; gauge location | Laboratory separates fixture movement |
| Hold and recovery | Duration, sampling times and unload procedure | Quality retains the complete trace |
| Replicates and outcome | Individual curves, movement/force limit and failure mode | Procurement checks comparable scope before price |
Finance can compare bids only after conditions are the same. A cheaper test with a different temperature, shorter hold or omitted recovery record answers a different question and can require another laboratory booking.
ASTM D2990-17(2025) covers tensile, compressive and flexural creep testing of plastics. Its Note 1 distinguishes ISO 899 Part 1 tensile testing from Part 2 flexural testing and says results cannot be directly compared between the ISO and ASTM methods. For metal-to-metal adhesive creep, ASTM D1780 ties test duration to the service question and the uncertainty of extrapolation. Keep the exact method and edition on the request.
Frequently asked questions
Is creep the same as stress relaxation?
No. Creep occurs during maintained loading and records the resulting deformation, while stress relaxation records declining stress with maintained strain. Both are time-dependent responses, and can occur in the same polymer. The choice depends on the application’s constraint: maintained weight indicates a creep question; fixed deformation indicates a retained-force question.
Why the distinction matters
The laboratory needs the intended constraint written on the request. For a hanging load, record extension over the hold. For a constrained strip, record the reaction force. Comparing two grades requires the same specimen geometry and conditioning as well as temperature. Changing any of those conditions changes the comparison being made.
What are the three stages of creep?
Primary creep has a decreasing deformation rate, secondary creep has an approximately steady rate, and tertiary creep has an increasing rate toward rupture. This familiar description is useful when those regions appear in the data. Not all test windows or materials show all three of these trends, so not every polymer curve should be divided into three parts.
Reading a limited test window
A short hold that ends during primary creep hasn’t measured a steady-state creep rate or established a creep-rupture time. Temperature drift, grip slip and a changing cross-section also need to be separated from the material response. Read the recorded loading ramp and the strain channel before assigning a stage to a curve.
What is the relaxation modulus?
Relaxation modulus is the stress remaining at a specified time divided by the strain imposed in an ideal step-strain test. For tensile response, it’s often written as E(t). In the linear region, it’s independent of the strain amplitude at the stated temperature and state of the material.
Units and comparison
Report modulus in Pa or MPa and identify whether the experiment is tensile or shear. The ratio uses the strain imposed on the specimen, with the loading ramp separately recorded. Within the linear region, normalized curves from different strain amplitudes should coincide. Curves that separate call for a closer check of amplitude, temperature or specimen condition.
Does creep stop when the load is removed?
The applied-load creep stage ends on unloading, but deformation can continue to change during recovery. Some materials return to their original dimensions completely while others retain plastic deformation, so record the recovery time before calling residual strain permanent.
What is a stress rupture test?
Stress rupture testing measures time to failure under specified sustained stress and temperature. A creep test follows deformation with time and can end before failure. Creep rupture is therefore an endpoint that needs its own observation; surviving a short test does not supply a measured rupture life. Specimens that haven’t failed should be considered as unfailed at the time of stopping, not assigned an artificial life.
Can stress relaxation occur at room temperature?
Yes. Many polymers show measurable stress relaxation at room temperature. The response depends on molecular mobility, structure and the time window. High temperatures aren’t a requirement.
How long should a creep test run?
Run it long enough to capture the service or screening response of interest and to answer the defined service or screening question. There’s no standard time that would qualify all polymers and bonds. Creep analysis using a short accelerated test requires a validated relationship to the specified conditions before it can predict long-term behavior. When evaluating material creep over an extended period of service, separate a directly measured hold result from a modeled projection and state the range over which that model was checked.
Bring the loading condition to the bonding discussion
Tengyang supplies hot-melt adhesive films, webs, powders and granules. For a bonding trial, bring the substrate pair, bond geometry and the force or movement that must be maintained. Start with viscoelastic response in adhesive bonding to connect the test question with material selection and sample evaluation.
From polymer response to a joint requirement
Tengyang’s bonding work connects adhesive form and substrate choice with processing conditions. This comparison focuses on creep, stress relaxation and the measurements needed to describe them. The worked arithmetic and screening examples use assumed inputs; product decisions require the chosen grade and prepared joint to be evaluated under the specified conditions.
References & Sources
- Polymer creep and stress relaxation, Penn State.
- Viscoelasticity Notes, Rod Lakes, University of Wisconsin.
- Materials science mechanics and viscoelasticity text, Northwestern University.
- Linear viscoelastic parameter interconversion, Chen et al., Materials, 2023.
- Creep of flexible adhesive joints, Duncan and Ogilvie-Robb, NPL CMMT(A)225, 1999.
- Creep behaviour of bonded polyethylene joints, Saeimi Sadigh et al., 2020.
- ASTM D2990-17(2025), plastics creep methods.
- ASTM D2294-96(2024), adhesive shear creep.
- ASTM D1780-05(2020), metal-to-metal adhesive creep practice.
- ASTM D2918-99(2020), stressed adhesive-joint durability.
- ASTM D6147-97(2026), rubber and thermoplastic-elastomer compression force decay.