Get in touch with Tengyang Company


Updated October 2026
Differential scanning calorimetry measures how a sample releases or absorbs heat during a controlled temperature program. Identify a polymer curve by indicating the axes and scan segment first, then distinguish a glass-transition step from crystallization and melting peaks. The position of a peak indicates the temperature or time of an event, depending on the horizontal axis; the properly integrated area of the peak gives its energy.
Quick reading guide
- Measured response: differential heat flow, commonly reported in mW or W/g.
- Glass transition: a change in the baseline associated with heat capacity.
- Melting and crystallization: endothermic and exothermic events, respectively.
- Essential context: heating or cooling, scan rate, sample mass, pan and atmosphere.
Differential scanning calorimetry is a thermal analysis method for identifying heat-capacity changes and thermal events. Read sign convention and scan history before assigning peaks. Use peak temperature and transition enthalpy as separate results.
Key points
- A second heating scan can remove useful evidence of processing history.
- An upward peak can be endothermic or exothermic: the axis convention decides.
- A missing glass-transition step can reflect a weak or obscured signal.
- Melting behavior helps plan bonding trials; bond strength comes from testing the bonded assembly.
What differential scanning calorimetry measures
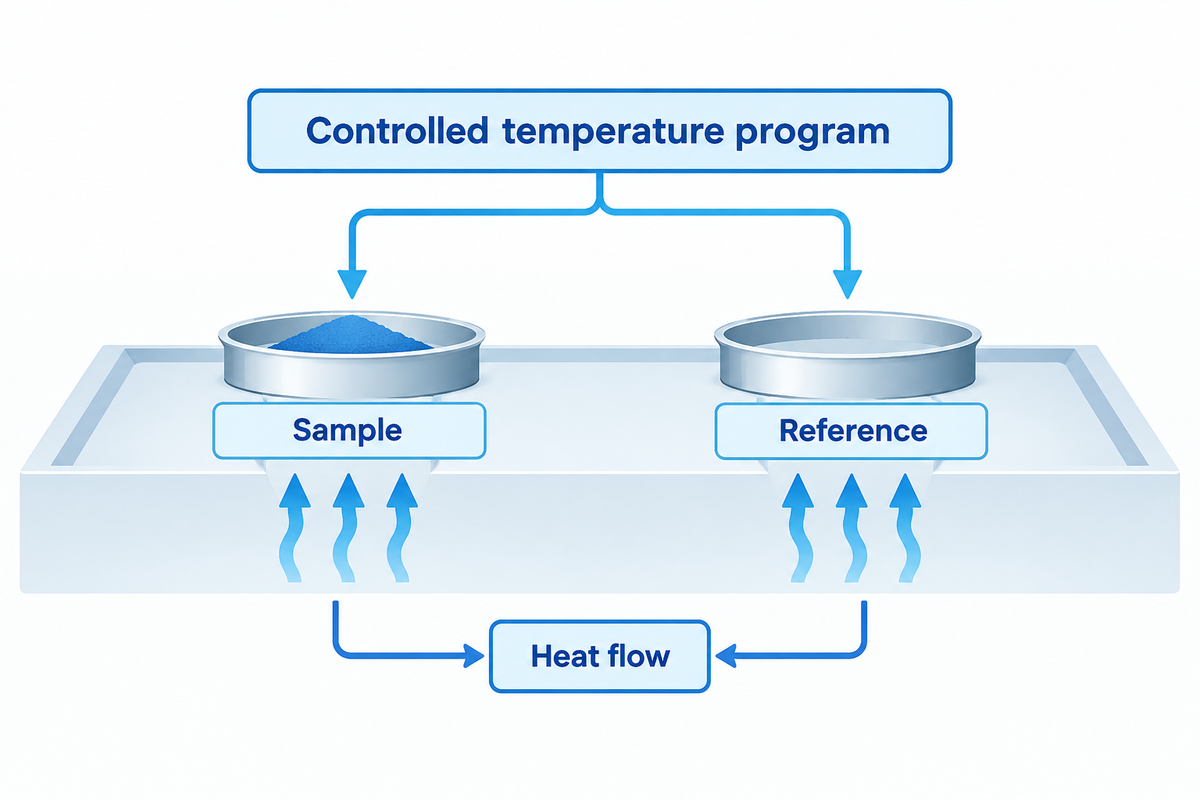
A differential scanning calorimeter compares the thermal behavior of a sample and a reference under a prescribed temperature program. The instrument records heat flow as a function of temperature or time. Changes in that behavior represent the energy absorbed or released by a transition and/or a change in heat capacity.
One can consider two small containers side by side and think of warming both of them. A sample that starts melting requires more energy than an empty reference pan. The measuring system detects that change in heat demand. This simple description of DSC explains the signal; naming the event requires knowledge of the sample and the test conditions.
Two commonly used types of DSC use different instrumentation. In heat flux DSC, the temperature difference between the sample and the reference is measured and converted to heat flow through calibration. That difference is usually expressed as ΔT. Power compensation DSC uses independently controlled heaters. A difference in the amount of power supplied keeps the sample and reference at the same temperature. Hence, power compensating DSC and heat flux instruments address the same analytical question through different hardware.
What does differential scanning calorimetry tell you?
DSC pinpoints thermal response changes, and with the right calibration and analysis, gives relative energy changes. For polymers, that includes glass transition, melting, crystallization and certain curing reactions. A trace helps evaluate processing histories only if specimens being compared were measured under the same conditions.
A laboratory using DSC to characterize the thermal properties of an unfamiliar film might first locate its events, then use spectroscopy to analyze its composition. That division is important. Overlapping peaks in a blend can mask several components, so composition should be checked with a complementary method. Penn State’s polymer thermal-transition lesson describes the main shapes and explains why not all polymers display all of them.
Start with the axes and the temperature program
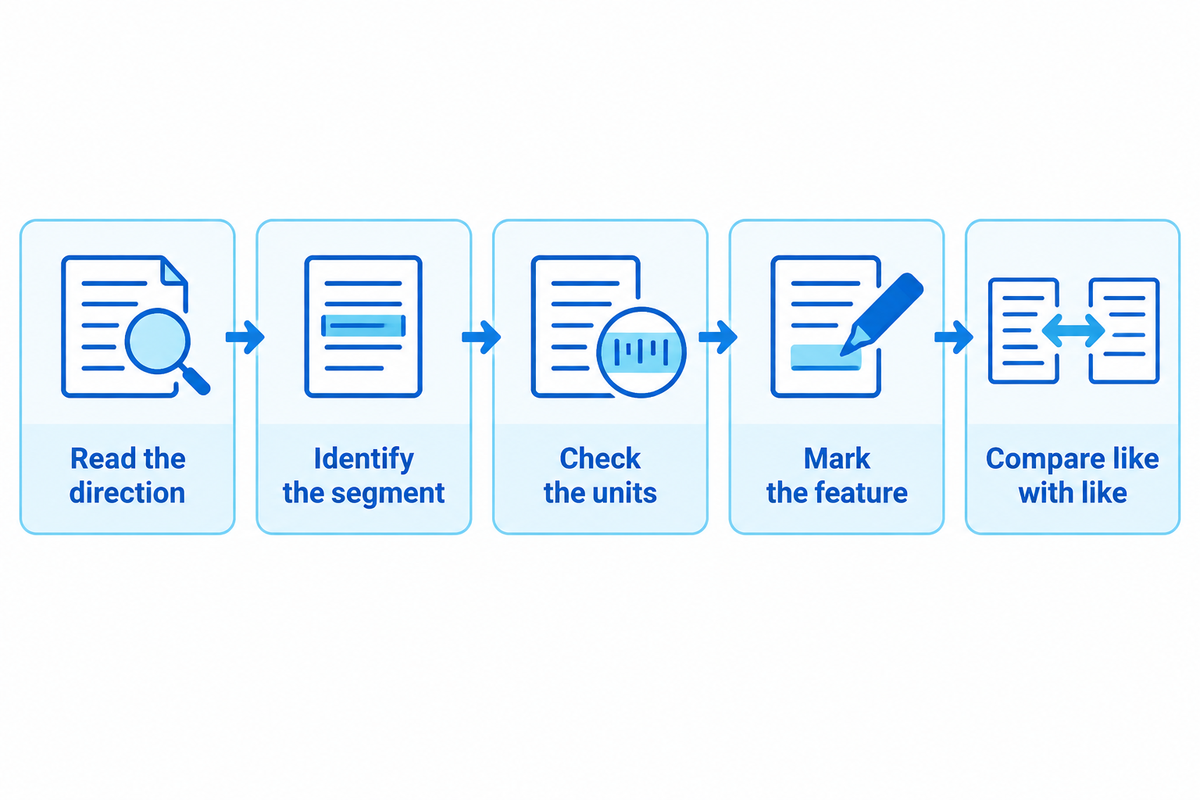
Begin a DSC analysis with the heat-flow units, endothermic direction and scan sequence. A heating curve and a cooling curve describe different parts of the experiment. Mass-normalized traces and raw power traces differ. Matching those characteristics prevents an apparent material difference because of how the reports were prepared.
How do I interpret DSC data?
Interpret DSC data by reading the axes, identifying the temperature-program segment, locating baseline steps and peaks, and then testing each proposed assignment against the sample history. For integrated energy, baseline, integration limits and sample mass should be considered as well.
- Read the direction — locate the endothermic arrow before naming a peak.
- Identify the segment — label first heating, controlled cooling and second heating separately.
- Check the units — distinguish mW, W/g and heat-capacity units.
- Mark the feature — identify a step, peak, shoulder or drift before proposing its cause.
- Compare like with like — align rates, atmosphere, pans and the reported temperature criterion.
A heating rate needs a time denominator: 10 °C/min describes a ramp; 10 °C describes a temperature interval. The sample pan, also called a crucible, affects heat transfer and contact with the DSC cell. Sample and reference pans should follow the method’s preparation requirements, including the appropriate lid arrangement. Uneven contact changes heat exchange with the sensor and can distort heat flow measurements.
Small peak shifts deserve particular care. NIST explains that DSC requires calibration for accurate temperature, enthalpy and heat-capacity measurements. Precisely measuring the heat flow requires a stable baseline as well as appropriate calibration. When a difference is comparable with repeatability or measurement uncertainty, the practical next step is a controlled repeat, rather than rejecting a batch on the plotted separation alone.
Recognize the heat-capacity step at glass transition
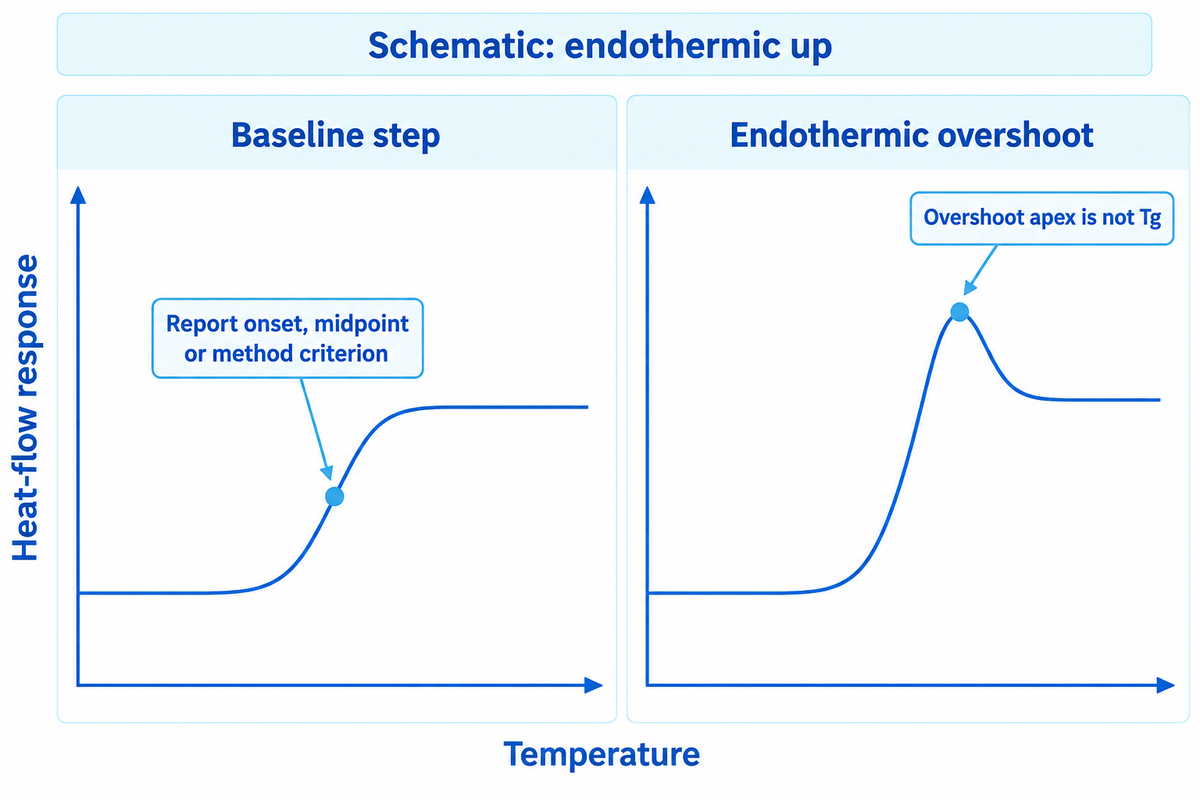
Glass transition usually appears as a baseline step because the polymer’s specific heat capacity changes as molecular segmental motion becomes accessible. Locate this step prior to interpreting overshoot. A reported glass transition temperature should identify the chosen onset, midpoint or other method criterion, together with the scan conditions.
“The glass transition is manifested as a step change in specific heat capacity.”
Enthalpic recovery can lead to an endothermic overshoot near the step, especially with physical aging. Picking the top of the endothermic overshoot as Tg confuses two different features. ASTM E2602-24 describes other temperature-modulated measurements to distinguish between kinetic and heat-capacity contributions when these effects are interfering.
A missing second step is also useful to interpret carefully. In Gumede and colleagues’ PBS/polycarbonate nanocomposite study, minor polycarbonate glass transition was difficult to detect by DSC. Crystallization reduced its mobile amorphous fraction. The researchers’ dynamic mechanical test configuration couldn’t reach the relevant transition before the main PBS phase melted. However, microscopy showed two phases. Thus, for a buyer evaluating an unknown blend, the important point is that one visible step isn’t enough to conclude that the blend is a single-phase system. Sample composition, signal strength and the next method’s usable temperature range all matter.
For selecting an adhesive, relate the measured transition to the application temperature and loading. Our guide on glass-transition behavior in adhesive selection provides links to these relations.
Read crystallization and melting peaks in context
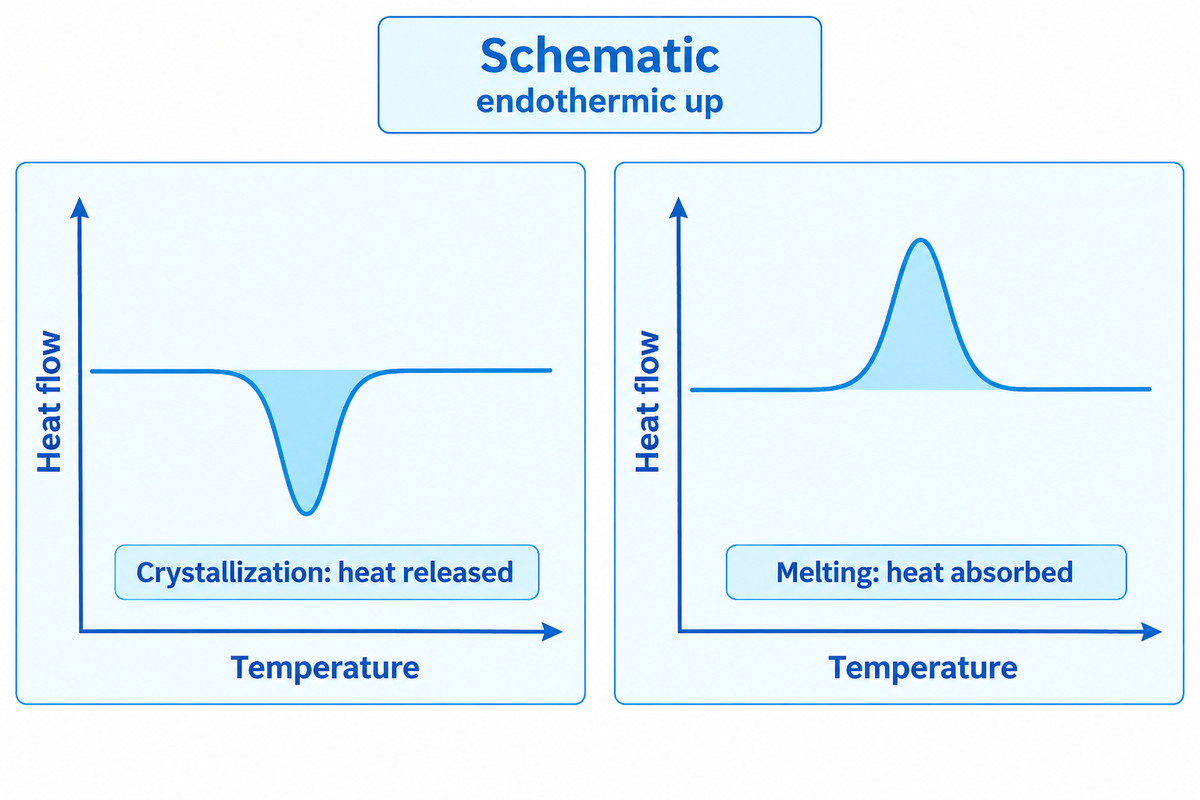
Crystallization releases heat, while melting absorbs heat. On a polymer DSC trace, their plotted directions follow the instrument’s sign convention. The temperature program then narrows the interpretation: crystallization may occur during cooling or during reheating as cold crystallization, whereas a melting endotherm reflects the loss of crystalline order.
Polymer DSC curve feature key
The Polymer DSC curve feature key shows observable shapes and aids in identifying candidate events within the context of the experimental setup and instrumental check.
| Observed feature | Candidate interpretation | Context to examine |
|---|---|---|
| Baseline step | Glass transition | Step criterion and surrounding baseline |
| Overshoot beside a step | Enthalpic recovery | Aging and first-versus-second heating |
| Endothermic peak on heating | Melting | Crystalline material and possible volatile loss |
| Exothermic peak on cooling | Crystallization | Cooling rate and previous melt history |
| Exotherm before melting on heating | Cold crystallization | Prior cooling and remaining crystallizable fraction |
| Irreversible heating exotherm | Cure or another reaction | Reactive chemistry and repeat-scan behavior |
| Shoulder or double peak | Overlapping populations or reorganization | Rate dependence and complementary composition data |
| Sharp, irregular excursion | Volatile release or contact disturbance | Mass change, pan condition and repeatability |
| Broad baseline drift | Changing heat capacity or experimental drift | Baseline run, contact and calibration |
Peak shape is rarely a unique fingerprint. TA Instruments’ discussion on unusual DSC events addresses relaxation, cold crystallization and volatile effects that complicate easy assignments. A chemical reaction or decomposition can cover a phase transition. Absence of mass loss helps to reduce the options, but still, several mass conserving processes can cause a peak.
The amorphous state of a polymer can be evaluated by the presence of a heat-capacity step and the absence of latent heat of melting. For a semi-crystalline specimen, heating and cooling are evaluated together. Differences between these transitions are discussed further in the glass transition versus melting point comparison.
Separate peak temperature from transition enthalpy
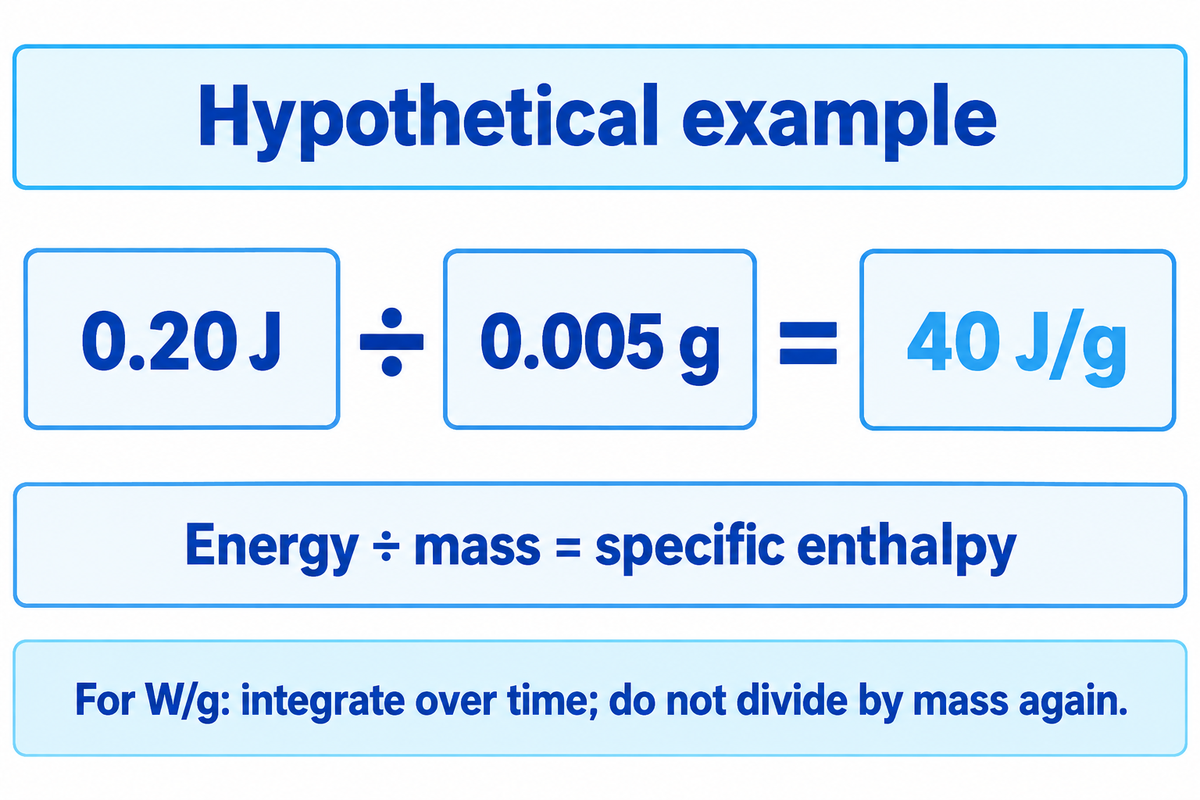
Assuming a transition energy of 0.20 J and a sample mass of 0.005 g, the specific enthalpy is 40 J/g. Peak temperature describes the event’s position. Peak area describes the energy after baseline correction and proper integration. Specific enthalpy reflects the integrated response per unit mass, including peak width.
The original study on de-smearing DSC signals defines time-integral as: subtract the baseline from calibrated heat flow, integrate over time, and divide by mass. Thus, area under the peak must be considered with both axes. Converting this time integral to a temperature integral is valid for a constant and nonzero scan rate.
Specific enthalpy: Δh = ∫(Φ − Φbaseline) dt / m.
With Φ in W, time in s and mass in g, Δh is in J/g. For a temperature integral, divide by β = dT/dt in K/s as well as mass. If the signal is already in W/g, don’t divide by mass again.
Consider units in examples. The balance reads 5 mg = 0.005 g. After baseline correction, the time integral of the software gives 0.20 J. Dividing energy by mass gives 0.20 ÷ 0.005 = 40 J/g. Suppose another sample has double the mass and double the integrated energy: its specific enthalpy is unchanged. Raw peak size would make the samples appear different, while the normalized results would agree. Check if the exported trace already includes mass normalization. Dividing a W/g trace by sample mass a second time would be incorrect.
The enthalpy of transition can be used to determine a crystalline fraction only with an appropriate reference and treatment of overlapping events. The filler fraction changes the polymer mass denominator in this quantitative analysis. A J/g result by itself isn’t a percentage of crystallinity. A separate tutorial on DSC capacity measurement explains how the amount of heat required for a temperature increase relates to specific heat and not peak integration.
Why the same polymer can produce different curves
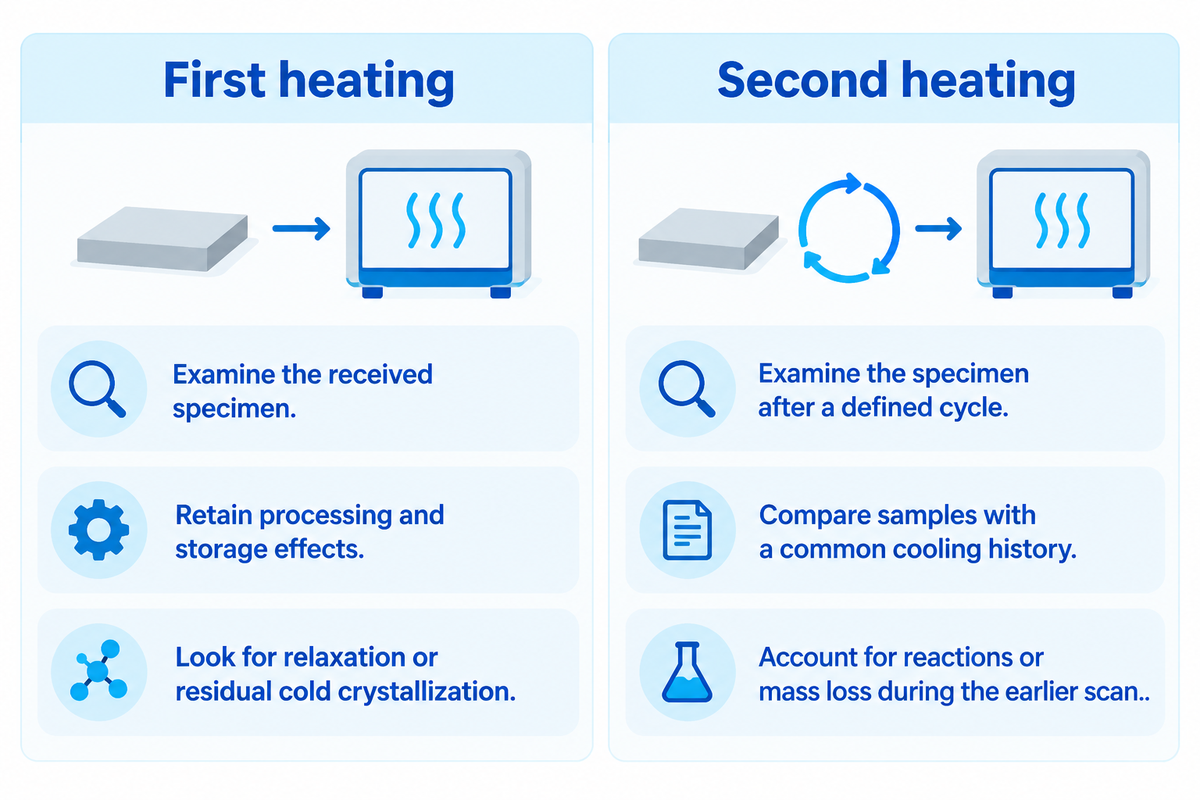
Historical factors such as processing history, scan rate, composition, and specimen preparation can alter a polymer’s DSC curve. First heating retains information about the material received. Controlled cooling and the second heating represent a more comparable thermal history. However, irreversible chemistry or loss of material during the first cycle can change what’s measured.
Fast scans leave less time for molecular rearrangement and increase thermal lag. Therefore, a shifted DSC peak may represent kinetics or heat transfer rather than a new material. Even with the same nominal temperature program, lack of good pan contact or differences in mass can affect the temperature of the sample relative to the sensor. The programmed temperature of a material therefore is an incomplete description of the actual thermal state of a sample during a fast event.
First heating
- Examine the received specimen.
- Retain processing and storage effects.
- Look for relaxation or residual cold crystallization.
Second heating
- Examine the specimen after a defined cycle.
- Compare samples with a common cooling history.
- Account for reactions or mass loss during the earlier scan.
A NETZSCH thermoplastic-polymer application study employed heating, cooling and reheating at 10 K/min. For some PET samples, differences almost completely disappeared during the second heating and were therefore consistent with a strong processing-history contribution. Differences for PA6 remained. For the PP example, cooling revealed differences less apparent in the heating curves. Therefore, selecting only the best-looking trace may discard useful information from the other scan segments.
Thermal similarity also has limitations for identification. Šudomová and colleagues’ preliminary study of 14 PET samples showed that a two-parameter approach wasn’t always successful in distinguishing the different groups of samples. The authors then expanded their study to 76 samples to perform a multivariate analysis. Identifying a recycled-polymer batch still requires the method and comparator to be specified.
Use complementary thermal analysis for ambiguous events
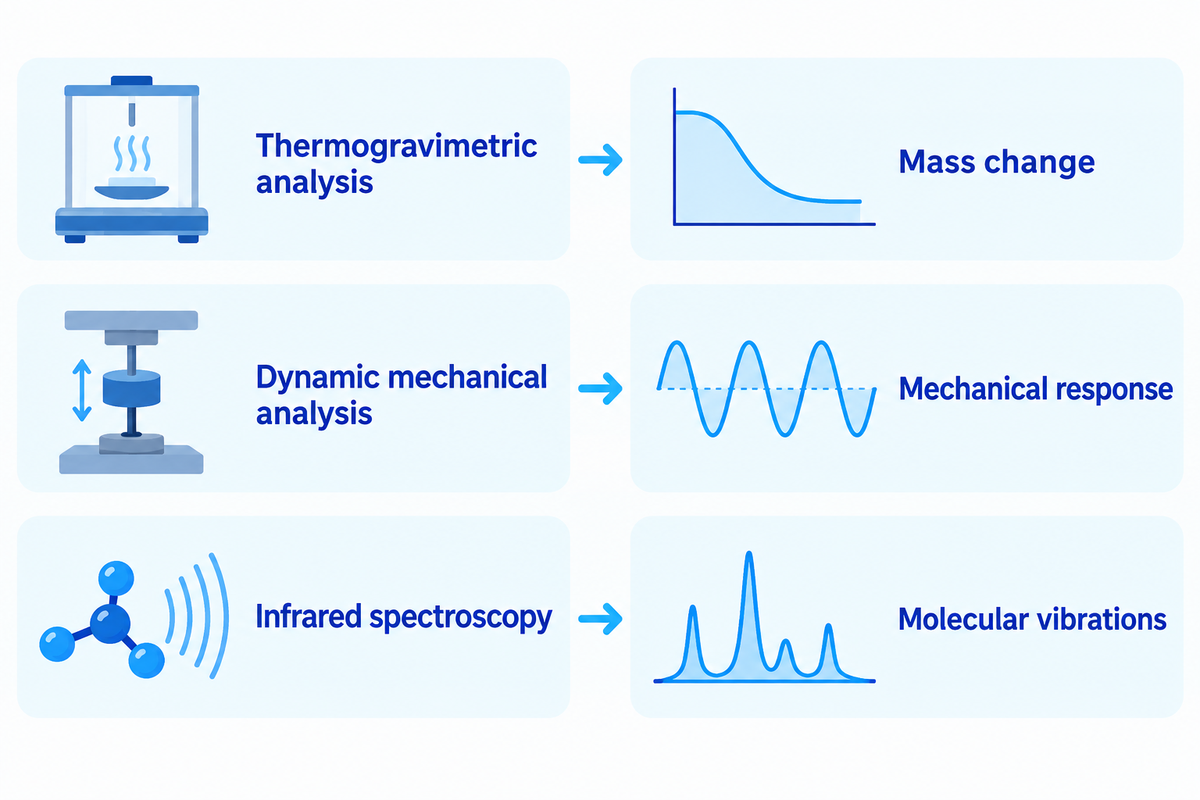
The next analysis depends on the unresolved quantity. THERMOGRAVIMETRIC ANALYSIS measures mass change; DYNAMIC MECHANICAL ANALYSIS measures mechanical response; INFRARED SPECTROSCOPY measures molecular vibrations. Modulated DSC is used to separate heat-capacity and kinetic contributions. These methods add different observations, so their transition temperatures need not coincide.
DTA (or Differential thermal analysis) registers a temperature difference between a sample and the reference. DSC uses calibration to express a heat-flow response. Interpreting these thermoanalytical methods requires a different approach. A common error in practice is to read a DTA trace as an enthalpy measurement without the appropriate calorimetric treatment.
| Observation or question | Next useful measurement | What it adds |
|---|---|---|
| Endotherm with suspected moisture or solvent | Thermogravimetric analysis | Whether mass loss accompanies the event |
| Unclear Tg beneath relaxation | Temperature-modulated DSC | Heat-capacity-related and kinetic responses |
| Softening under service load | Dynamic mechanical analysis | Modulus and damping under a defined deformation |
| Uncertain polymer chemistry | Infrared spectroscopy | Chemical-group information |
| Uncertain crystalline structure | X-ray diffraction | Structural information about crystalline phases |
| Suspected filler dilution of J/g | Composition or residue analysis | A better basis for polymer-mass normalization |
| Exotherm suspected to involve oxidation | Controlled-atmosphere comparison | Sensitivity to the selected gas environment |
| Small, inconsistent peak shift | Calibrated repeat DSC measurements | Repeatability relative to the observed difference |
| Bond strength after a thermal trial | Peel, shear or application-specific joint test | Performance of the actual bonded assembly |
The example of the missing-transition demonstrates a key practical limitation. An alternative method must be congruent with the specimen state and temperature range. A mechanical attachment designed to secure a solid bar may not be of any use once the supporting material melts. For issues pertaining to load, Richie Anfinsen’s material-substitution analysis illustrates how the temperature-dependent modulus and creep can help differentiate materials with similar data at room temperature.
Turn a polymer curve into a useful material decision

The thermal behavior of a material under study may be determined using a polymer DSC curve. For hot-melt bonding, melting and crystallization help frame heating and cooling trials. Finally, viscosity and wetting, in combination with the temperature of the substrate and joint testing, determine if the adhesive spreads out and makes the desired bond.
A 2026 acrylate hot-melt study by Shi and others shows that easy flow doesn’t guarantee strong adhesion. With ODV-2966 adhesive on polyester fabric, the authors found that an increase in coating temperature from 130 to 160 °C increased the penetration depth from 16 to 25 µm. Along with the decrease in the peel strength and the loop tack, they suggested that the effective adhesive layer became thinner. The authors, however, didn’t measure the thickness of that layer. This is an adhesive supplied by Hongdingfang, and one of the authors is an employee of Hongdingfang. For a fabric-bonding trial, the result suggests measuring the bonding performance and the penetration depth together, instead of choosing the condition with the best flow.
A good trial keeps adhesive grade, substrate pair, and coating amount fixed and varies the intended process variable. Record interface temperature independently, and compare cooled joints using the same peel-strength geometry and reporting units. An alternate failure mode may explain a case that the melt peak alone misses.
Teng Yang provides hot-melt adhesive materials in film, web, powder and granule forms. Material selection is dependent on the substrates and the application conditions. A DSC report may be helpful in this regard, but it wouldn’t turn an instrument peak into a universal bonding temperature recommendation.
Commission a DSC test that answers your question

Make the decision before ordering a DSC report: received-state characterization, controlled-history comparison, transition temperature measurement or integrated enthalpy. They may need different scans: received-state characterization reads the first heating, while a controlled-history comparison needs controlled cooling and a second heating. A useful laboratory brief describes the specimen, events, and comparison that will make the next material or process decision.
ASTM D3418-21 discusses transition temperatures and fusion and crystallization enthalpies of polymers. E1356 deals with glass transition, while E2602 deals with temperature-modulated evaluation. Select the method with the laboratory based on the material and measurement objective; sharing a method family doesn’t mean every polymer is appropriate for an identical program.
- State the grade, batch, sample conditioning and whether the received thermal history must be preserved.
- Request the complete heating, cooling and holding sequence, including scan rates and atmosphere.
- Include specimen mass, pan type, calibration basis and the reported transition criterion.
- For enthalpy, request integration limits, baseline treatment and the mass-normalization basis.
- Agree on raw data, repeats, uncertainty where relevant, interpretation and report delivery.
A testing laboratory does the analysis; an instrument manufacturer provides the DSC instrument; a material supplier helps choose the adhesive. Keeping those roles clear makes the request easy to understand, and the work quoted easier to compare.
Frequently asked questions
What are the applications of differential scanning calorimetry?
DSC is used to study glass transition, melting, crystallization and reaction heat.
Polymer applications include batch comparison, investigation of processing history and assessment of residual cure when the chemistry suits the method. Beyond polymers, organic and inorganic materials may be studied with appropriate equipment and procedures. Purity analysis is another specialized application. Each task needs its own assumptions: the conditions for a purity determination differ from those for comparing the thermal histories of two films.
What is FTIR and DSC?
FTIR examines infrared absorption; DSC measures thermal response during a temperature program.
FTIR stands for Fourier transform infrared spectroscopy. Absorption bands provide information about molecular vibrations and chemical groups. DSC measurements locate thermal events and, with suitable analysis, quantify their energy. When an unfamiliar sample has a broad endotherm, spectroscopy can help investigate its chemistry while calorimetry describes its thermal behavior. Reference spectra, formulation complexity and overlapping signals influence how specifically either result can be interpreted.
What is modulated differential scanning calorimetry?
Modulated DSC adds a periodic temperature variation to an underlying temperature program.
Analysis of the resulting response can help distinguish heat-capacity-related behavior from kinetic contributions. This is useful when relaxation or another event overlaps a glass-transition step. Modulation period, amplitude and underlying rate affect the experiment, so separated signals still require a physical interpretation. ASTM E2602 describes this approach for glass-transition assignment. The method is an additional measurement strategy, rather than a guarantee that every overlapping peak will become uniquely identifiable.
Who are the manufacturers of DSC instruments?
Examples include TA Instruments, NETZSCH and METTLER TOLEDO.
Choose equipment against the intended DSC experiment, temperature range, cooling performance and service requirements. Specialist options such as pressure DSC address additional experimental conditions. A material supplier and an independent testing laboratory perform different roles from an instrument manufacturer.
How long does differential scanning calorimetry take?
An assumed heating ramp from 20 to 220 °C at 10 °C/min takes 20 minutes.
The calculation is a 200 °C span divided by the programmed rate. This is one hypothetical segment, not a recommended polymer program or a complete report turnaround. Cooling, equilibration, holds and repeat DSC scans add instrument time. Sample preparation and interpretation add further work. If cooling can also run at 10 °C/min, a heat-cool-reheat DSC run over the same span adds up to three 20-minute ramps before holds and equilibration; an instrument that cools more slowly adds more. Isothermal holds need their specified dwell time added separately because the ramp calculation covers only changing temperature. The laboratory may also schedule a baseline or calibration measurement before the specimen. An urgent batch-comparison request should distinguish time on the instrument from the deadline for an interpreted report, including any repeats needed to resolve an ambiguous feature.
Discuss your adhesive material trial
Share your substrate pair, adhesive form, current heating cycle and required bond performance with Teng Yang. Include any thermal and joint-test results so the material discussion starts with the conditions your application actually uses.
The example of a numerical integration is hypothetical. Published experiments are acknowledged; no Teng Yang laboratory dataset is shown.
References & Sources
- Thermal Transitions and Differential Scanning Calorimetry Pennsylvania State University, MATSE 202.
- An RM for Temperature and Enthalpy Calibration of Differential Scanning Calorimeters National Institute of Standards and Technology, 2025.
- E1356-25: Assignment of the Glass Transition Temperatures by Differential Scanning Calorimetry ASTM International.
- E2602-24: Assignment of the Glass Transition Temperature by Modulated Temperature Differential Scanning Calorimetry ASTM International.
- Morphology, Nucleation, and Isothermal Crystallization Kinetics of Poly(Butylene Succinate) Mixed with a Polycarbonate/MWCNT Masterbatch Gumede et al., Polymers, 2018.
- Data-driven de-smearing of DSC signals Journal of Thermal Analysis and Calorimetry, 2022.
- PET sample characterization study Šudomová et al., Journal of Thermal Analysis and Calorimetry, 2023.
- Drop-in Materials: A Strategic Approach, Temperature Effects Richie Anfinsen, Plastics Technology, 2026.
- Wetting Behavior of Acrylate Hot-Melt Adhesive on Polyester Fabric Substrates and Its Influence on Adhesion Performance Shi, Qian and Shi, Polymers, 2026.
- D3418-21: Transition Temperatures and Enthalpies of Fusion and Crystallization of Polymers by Differential Scanning Calorimetry ASTM International.