Get in touch with Tengyang Company

Polymer Crystallinity: Meaning and Measurement Limits

Crystallinity in polymers is the fraction of a specimen assigned to ordered material, defined by stated limits and an analysis model. It isn’t an unrestrained, absolute count of perfectly aligned molecules in the specimen. Differential scanning calorimetry (DSC) is one technique used to evaluate crystallinity. The outcome is dependent on several factors, for example specimen condition and history, the reference state, and the choice of calculation method.
In the absence of a defined method, a number corresponding to crystallinity can’t be evaluated as a complete result. Relative changes in the number may occur due to several reasons including variation in specimen history, condition and test protocol, and the number by itself doesn’t establish crystal quality. In the context of materials science, such a number is called degree of crystallinity or crystalline fraction.
Decision rule: Compare protocols before percentages. Without both a method and specimen history, a crystallinity number is incomplete.
Reader questions: Readers may ask, what’s crystallinity of polymers? How is it measured? Factors that influence crystallinity are addressed in the following sections, together with illustrative examples. The three questions, “what is crystallinity in polymers”, “how to measure crystallinity of polymers” and “what affects crystallinity in polymers”, are covered in the sections below together with the degree of crystallinity in polymers, the factors affecting crystallinity in polymers and crystallinity in polymers examples; many of the concepts are structural or processing related, and the companion polymer physics for bonding guide connects them to materials science and technology.
What Crystallinity in Polymers Actually Means
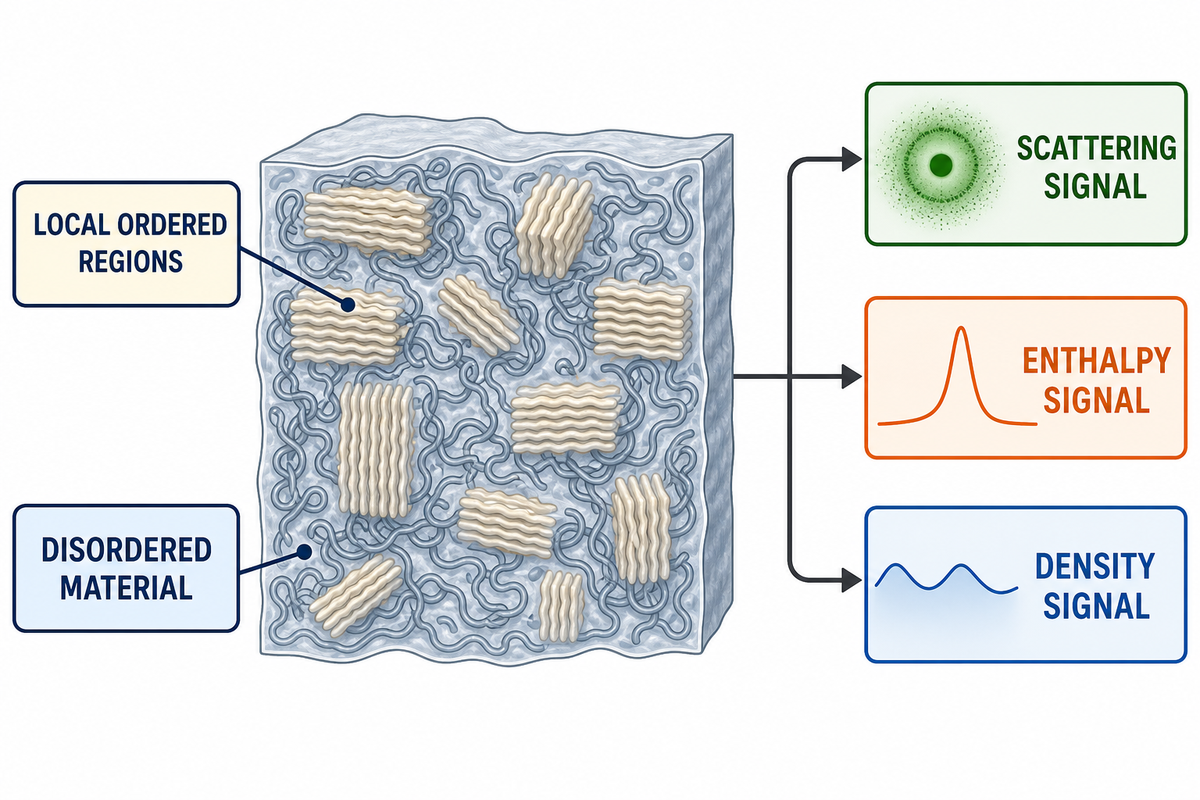
In a polymer, local crystal order can be restricted to certain regions while other material remains disordered. Ordered regions may be lamellar and are referred to as crystallites. Each crystallinity number defines the method-assigned extent of the ordered population within a material.
In materials science, “assigned” order may be attributed by a stated method to scattering/diffraction, enthalpy, or density effects.
The measurement is still important: in the context of a defined experiment, a crystallinity number expresses the degree of order in the system and may reveal changes due to differences in the process or ‘aging’ of the sample.
For a lab report, the biggest challenge is false precision: two different methods sometimes lead to different results, especially if the sample history and/or boundary conditions of the two methods differ.
Why Most Crystallizable Polymers Are Semicrystalline
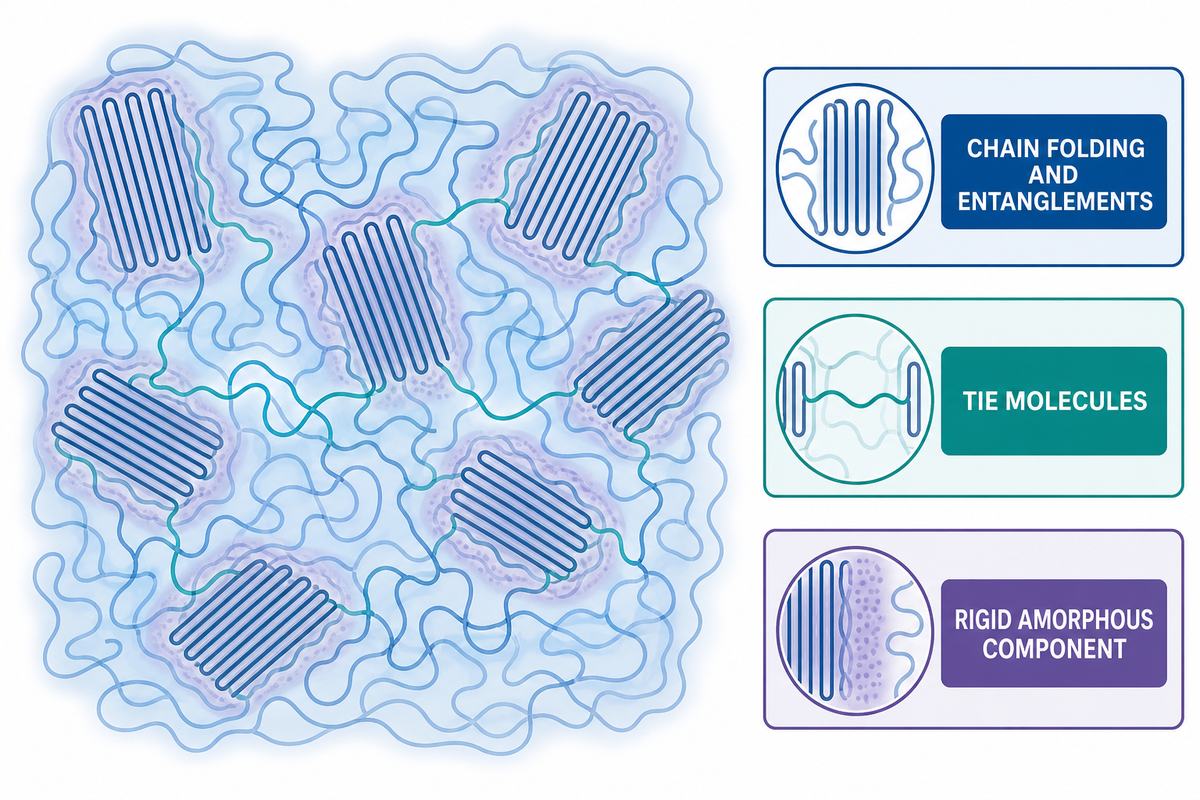
In general, long polymer chains lack the uniformity and order of small-molecule packings. Folding, entanglements and other kinds of irregularities disrupt the regular pattern and distribution of lamellae. Tie molecules connect parts of the morphology through the amorphous background. Where the irregularities dominate, they block packing and leave a largely amorphous morphology with scattered lamellae. Crystalline polymer and amorphous polymer are convenient labels, but an adequate description needs a more precise account of sample structure and morphology.
Two-phase models group crystalline and amorphous components during modeling. Such a simplistic model can be useful to estimate various parameters. The three-component model allows a rigid amorphous component. In the absence of other information, a three-phase model can distinguish a rigid amorphous component from the bulk amorphous component without assuming that fraction is crystalline.
A completely disorder-free system or specimen is a theoretical, fully crystalline reference state used in calculations. In practice, a system may contain a considerable degree of disorder, and different degrees of order, even if it was considered ‘fully crystalline’.
Comparisons of production can miss a rigid interphase when a two-phase assumption is used. This produces apparent accuracy, and misleads the viewer; models of phases and their limits should be stated.
| Common wording | Measurement-safe interpretation |
|---|---|
| crystalline and amorphous regions; amorphous and crystalline; amorphous and crystalline phases; amorphous or crystalline; crystalline phase; crystalline domains; ordered crystalline | A semicrystalline polymer can have crystalline regions dispersed within amorphous material and an interphase. These are model populations, not always sharp physical borders. |
| polymer molecules; long polymer chains; polymer structures | Polymer molecules need mobility to organize. When polymer chains are sufficiently free, polymers can crystallize upon cooling; if polymer chains do not get enough time, they cannot order themselves into crystalline domains. Any statement about “crystalline domains at this temperature” must name the measurement temperature and specimen history. |
| calculate the degree of crystallinity; determine the degree of crystallinity; used to determine the degree; percent crystallinity | To calculate the degree of crystallinity for a polymer sample, identify the method, reference, normalization and specimen history. No route can determine the degree of crystallinity without those choices. |
| crystallinity of a polymer; crystallinity in a polymer; field of polymer crystallinity | These phrases are shorthand. Measured crystallinity of a polymer is an assigned fraction, while the broader field of polymer crystallinity also considers crystal quality, polymorph, orientation and interphase. |
| density of the polymer crystal; polymer from its overall density; polymer crystal | A density model uses the density of the polymer crystal and an amorphous reference to estimate crystalline fraction from the polymer’s overall density. Voids, composition and reference choice limit the inference. A metal in a composite polymer changes bulk density and normalization, so a density calculation must separate filler from polymer mass and volume. |
| crystallization of polymers; polymer crystallization; crystallinity is influenced | Polymer crystallization is kinetic as well as structural. Crystallinity is influenced by cooling, annealing, orientation and nucleation, so the crystallization of polymers must be tied to a stated process. |
| properties of the polymer; properties of the bulk polymer; chemical properties of the polymer | Search phrases such as “semi-crystalline polymers are more chemically-resistant,” “polymer strength is increased,” or “degree of crystallinity increases hardness” express tendencies, not universal laws. Crystallization affects optical response too, but crystal quality and orientation may matter as much as fraction. |
| higher crystallinity; high degree; increasing the degree of crystallinity; amount of crystalline | A highly crystalline or crystalline material has more material assigned to the ordered population under one model. Increasing the degree of crystallinity does not by itself result in the highest degree of strength, barrier performance or bond quality, and the highest degree of polymer crystallinity is not automatically the best design target. |
| polymer contains; polymer that is crystalline; polymers tend; semi-crystalline polymers tend | A polymer that is crystalline in part is usually semicrystalline. Polymers tend to have crystalline regions only when structure and history permit; semi-crystalline polymers tend to retain amorphous material, and polymers often vary across a processed section. |
| PEEK is a semi-crystalline polymer; crystalline APTIV film | PEEK is a semi-crystalline polymer, and crystalline APTIV film is one commercial example. Neither example supplies a universal reference value for another chemistry or grade. |
| characteristics of a semi-crystalline polymer; semi-crystalline polymer and therefore; crystallinity display the characteristics | Characteristics of a semi-crystalline polymer cannot be inferred from the label alone. “Semi-crystalline polymer and therefore” is an incomplete phrase until it names the property, test and conditions; likewise, “crystallinity display the characteristics” is search wording, not a technical conclusion. |
| produce parts of consistent crystallinity; process depends on the degree; polymer is forced | To produce parts of consistent crystallinity, control cooling, thickness, conditioning and sampling. The process depends on the degree of mobility available, and when a polymer is forced into orientation the result affects the material and its diffraction pattern. |
| upon a number of factors; number of factors including; factors including the shape | An outcome depends upon a number of factors, including molecular geometry, tacticity, molecular weight and branching. Factors including the shape and regularity of the chain affect packing; degree of polymerization describes chain length, not crystalline fraction. Atactic polymers often resist regular packing because stereochemical disorder frustrates crystallization. |
What Controls Crystalline Fraction and Morphology
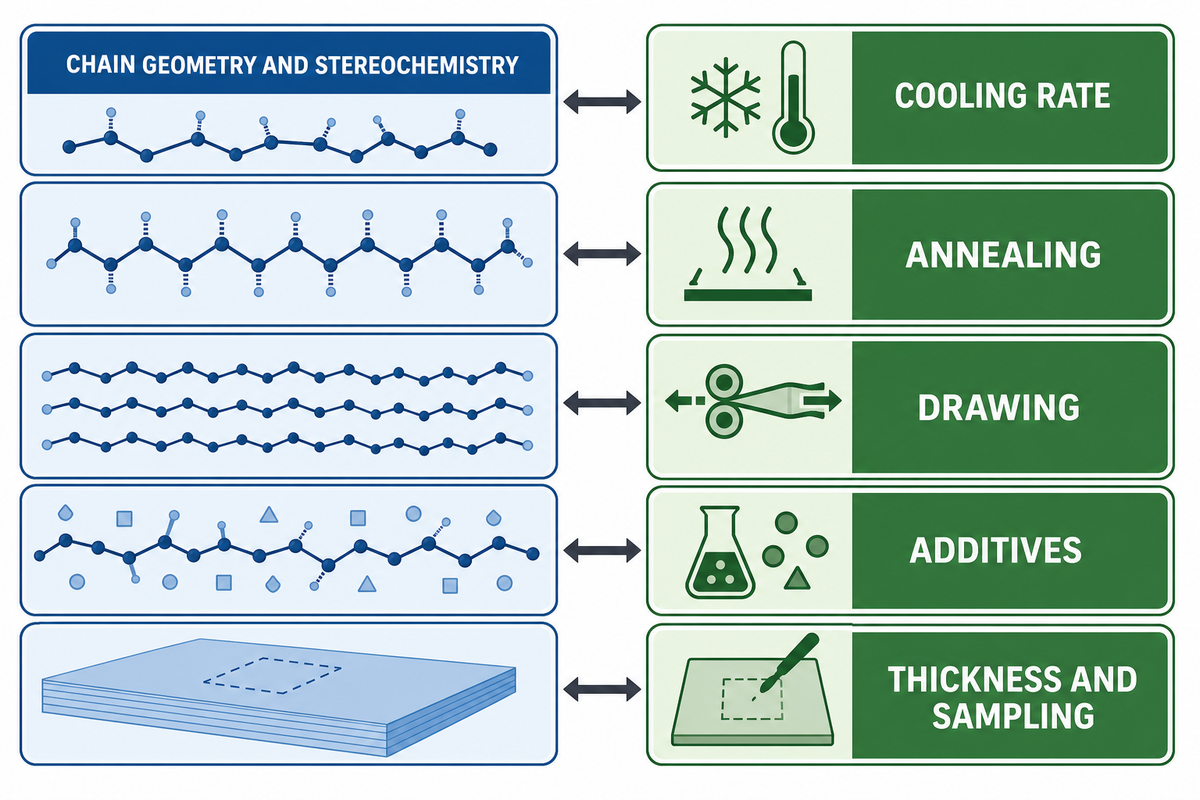
An important structural question asks whether a molecular structure can crystallize. Did the process allow it to crystallize? For that structural case, factors such as the geometric shape of chains, stereochemistry, and sequence of repeat units can encourage a more ordered packing. On the other hand, random distribution of comonomers, large and/or bulky side groups, and large and/or complex branching can lead to disorder.
Process factors, such as the rate of cooling, moisture, fillers and section thickness, can determine the degree of order in a polymer. Rapid cooling can result in a high amorphous content. Ordering of crystalline structures can occur during annealing, while drawing can align chains and change the diffraction pattern. Different zones of a sample can be affected differently based on moisture content.
In a production setting, apparent accuracy can disguise a sampling mismatch because cooling history and section thickness vary; production records should describe sampling location and process history.
For a controlled comparison: hold grade, formulation, specimen location, thickness, conditioning, cooling program and mechanical history constant. A change in the reported percentage is difficult to interpret when several of these variables change together.
Three Measurement Routes, and What Each One Observes
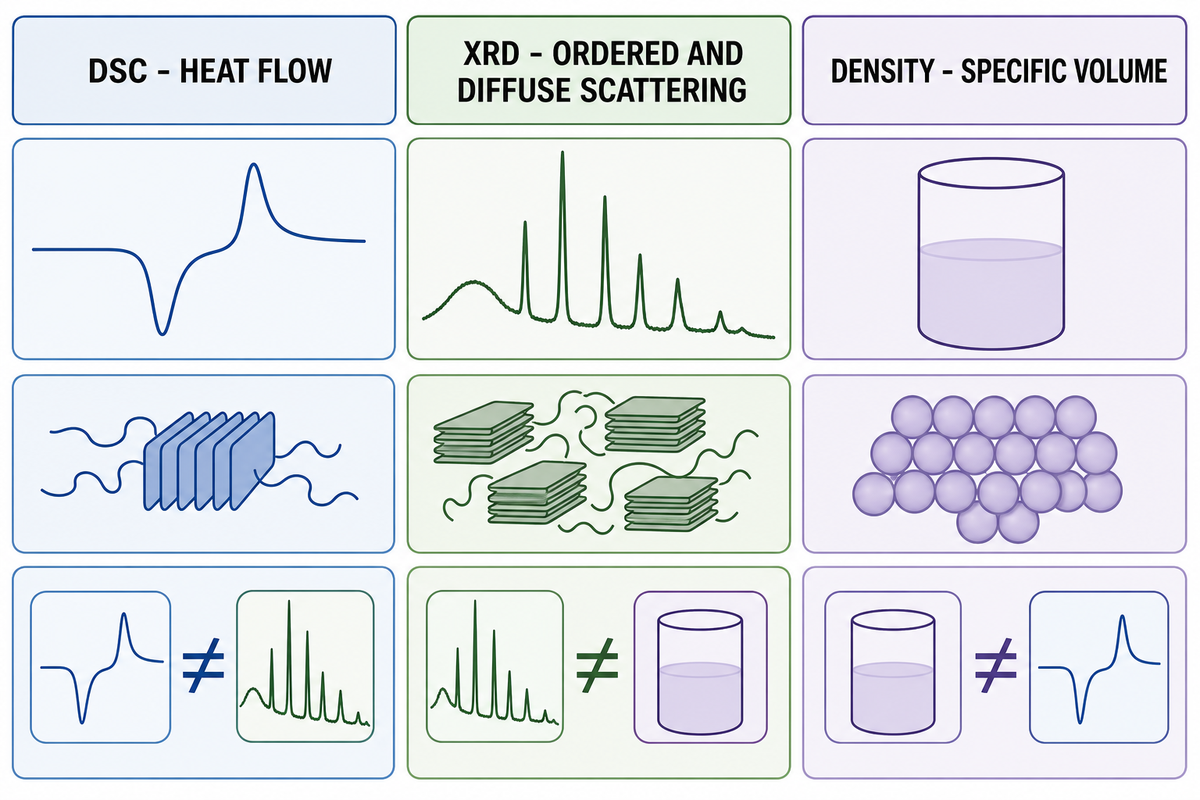
| Method | Observed signal | Main model decision | Strongest use |
|---|---|---|---|
| Differential scanning calorimetry (DSC) | Heat absorbed or released during melting, cold crystallization and crystallization | Baseline, event integration, reference enthalpy and polymer-mass normalization | Comparing thermal events and process history under a stated temperature program |
| X-ray diffraction (XRD or WAXD) | Ordered diffraction features and diffuse amorphous scattering | Background, peak separation, orientation, polymorphs and fitted ordered area | Examining structural order, crystal form and orientation with a declared geometry |
| Density | The specimen’s specific volume relative to reference states | Choice of crystalline and amorphous reference densities and mixture model | Bulk comparison when composition, voids and reference data are controlled |
Microscopy and spectroscopy can support morphological analysis, but they don’t automatically produce a mass fraction interchangeable with these three routes. Analytical technique choice must follow the decision question. Next, determine whether the concern is relative thermal stability, degree of structural order or predominant bulk composition. When the outcome of the analysis is critical, complementary techniques can show whether the same interpretation survives a change in the type of physical signal.
For an industrial lab, false precision is a concern when XRD, DSC, and density are employed. It’s recommended to employ the technique which most closely matches the decision to be made.
DSC Crystallinity Calculations Give a Conditional Answer
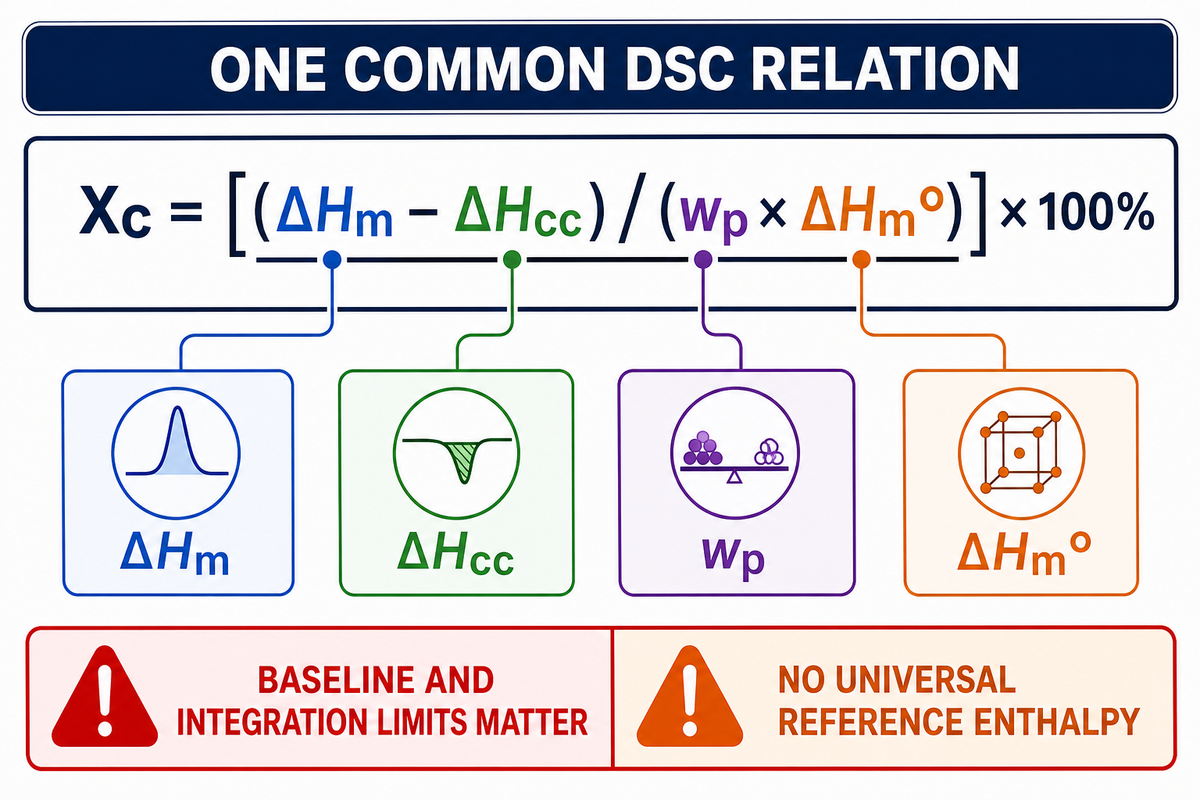
One common DSC relation is:
Xc = [(ΔHm − ΔHcc) ÷ (wpolymer × ΔHm°)] × 100%
Here, ΔHm is the integrated melting enthalpy, ΔHcc is cold-crystallization enthalpy where that correction matches the thermal program, wpolymer is the mass fraction of the polymer being evaluated, and ΔHm° is a justified enthalpy for the fully crystalline reference state of the relevant polymer and crystal form.
Consider a deliberately hypothetical calculation: melting enthalpy 60 J/g, cold-crystallization enthalpy 10 J/g, polymer mass fraction 0.80 and a justified reference enthalpy 200 J/g. The result is (60 − 10) ÷ (0.80 × 200) × 100% = 31.25%. It isn’t transferable to another resin. Changing the baseline, integration limits, event assignment, normalization or reference value changes the answer.
DSC heating isn’t always passive. During heating, polymer samples can anneal, recrystallize, and develop thicker lamellae before finally melting. Correction signs and events should follow the described process. The ISO 11357-3:2025 public scope covers conventional-DSC melting and crystallization temperatures and enthalpies. That public scope does not give a universal percent-crystallinity equation or a reference enthalpy.
Because enthalpy is derived and not directly measured in a process, error in baseline placement creates risk during calculations. Provide the actual temperature program used, baselines, and integration limits to reduce ambiguity. Also, provide standards and references used, if any.
Why DSC, XRD and Density Results Can Disagree
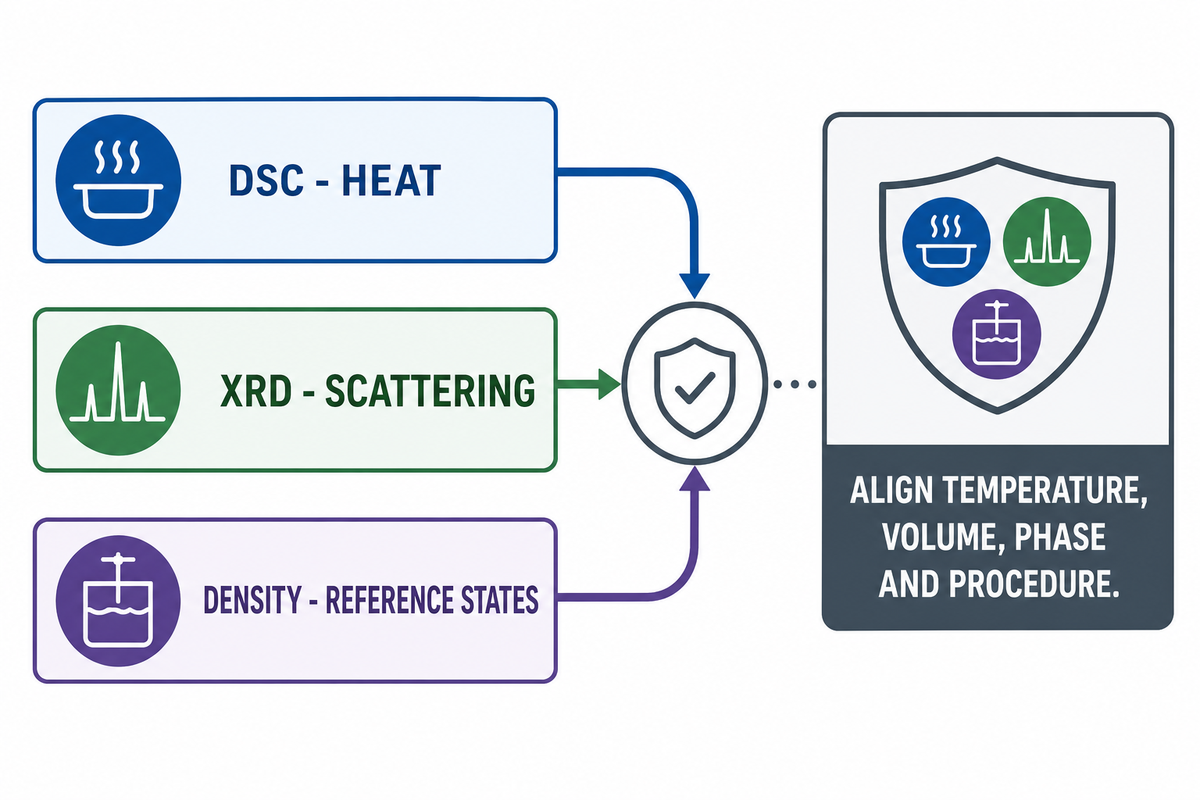
The method determines the result in measurement. Density employs reference standards. Preferred orientation and amorphous rigidity may also affect the results. Conventional DSC evaluates the behavior of a sample with respect to change in temperature. An X-ray diffraction result is limited to the temperature of the measurement and the geometry of the sample.
Tight definitions and restrictions lead to better agreement. In a 2003 study using a thermally matched First-Law approach, DSC was compared with density and x-ray diffraction and found to be in good agreement under specific definitions and conditions. The result of the study shouldn’t be construed as establishing or preferring a method. It’s better to evaluate the sample and the experiment details before concluding that the methods are inconsistent.
XRD still relies on peak partitioning. Density relies on a crystalline standard and an amorphous standard, as well as management of voids. DSC requires event integration and a crystal-form-specific enthalpy. The 2023 article provides examples of the degree of crystallinity versus crystalline quality analysis, which uses the same cellulose diffraction pattern to obtain 74%, 47% and 56% using different methods. It’s also important to consider the model being used, as the analysis results are dependent on the chosen model.
Laboratory comparisons can create a false mismatch due to the use of different thermal histories and phase models in DSC and XRD studies. Precise laboratory reports, however, align temperatures, sampled volumes and phase models before such mismatches are escalated.
Thermal History and Specimen Condition Are Part of the Result
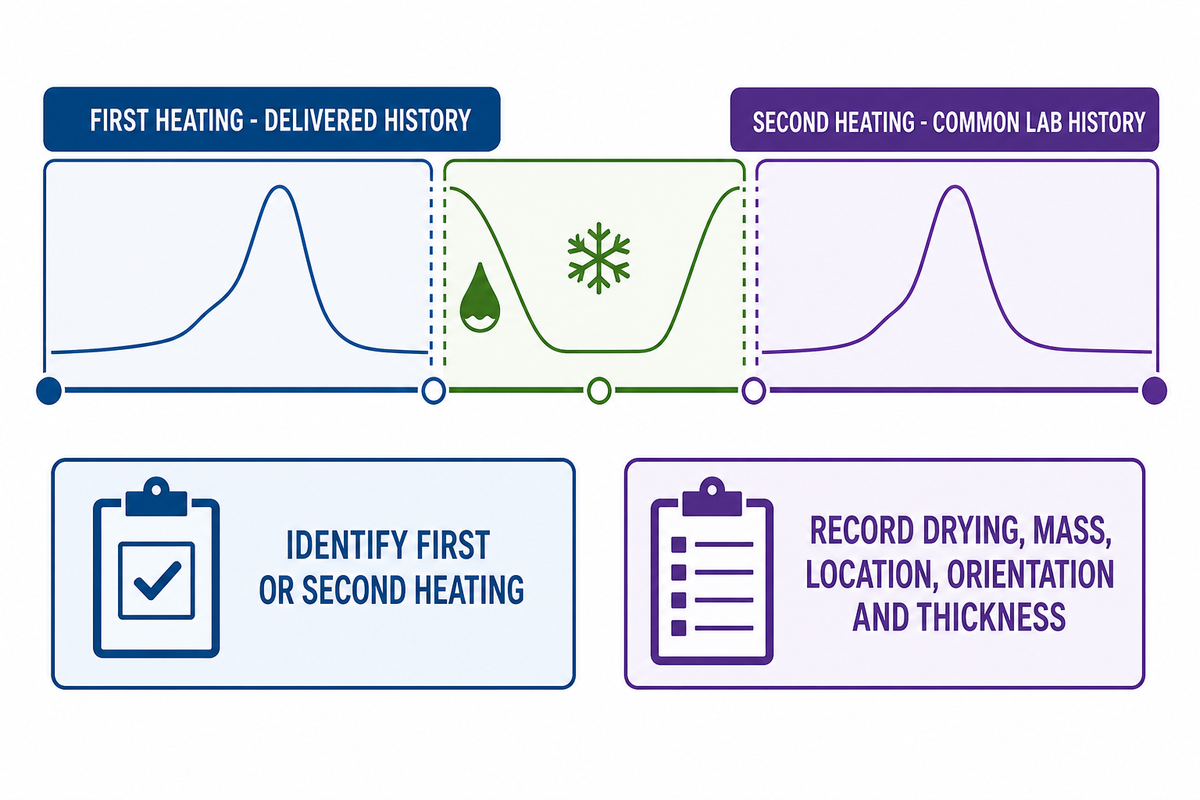
Results from the first heating run of a DSC study provide information on the sample’s thermal history due to prior processing. This may include cooling rate, annealing, storage and the history of mechanical loading, as well as the process history of the delivered part. The second heating run occurs after a prescribed melt and cool history. It provides information on the sample’s response to a standard laboratory history. Based on the DSC study, there’s generally no absolute correctness to the result of the first heating run versus the result of the second heating run. Each addresses a different question concerning the thermal history of the sample, so the report should identify the imposed cycle and whether it uses the first- or second-heating result.
A TA Instruments polyethylene example illustrates the distinction without establishing a universal value. Three materials were reported as 67.6%, 67.1% and 62.1% as received, then 64.6%, 64.7% and 64.9% after a common heat-and-cool history, using a selected polyethylene reference of 290 J/g. These numbers belong to that vendor example, materials and protocol; they shouldn’t be copied into another polymer report.
Record conditioning and drying where relevant, sample mass, sampling location, film orientation, thickness, prior mechanical history, heating and cooling rates, purge conditions and repeat measurements. Mention any factors which may limit the interpretation of differential scanning calorimetry.
Differential Scanning Calorimetry (DSC) studies are often conducted on production samples, and a first-heat scan records events such as a phase transition that occurred during the processing of a sample. DSC studies can also identify glass transition events, but first-heat and controlled second-heat scans provide information on different questions, so inspection records should preserve the history of a sample.
Crystallinity, Glass Transition and Melting Are Related, Not Interchangeable
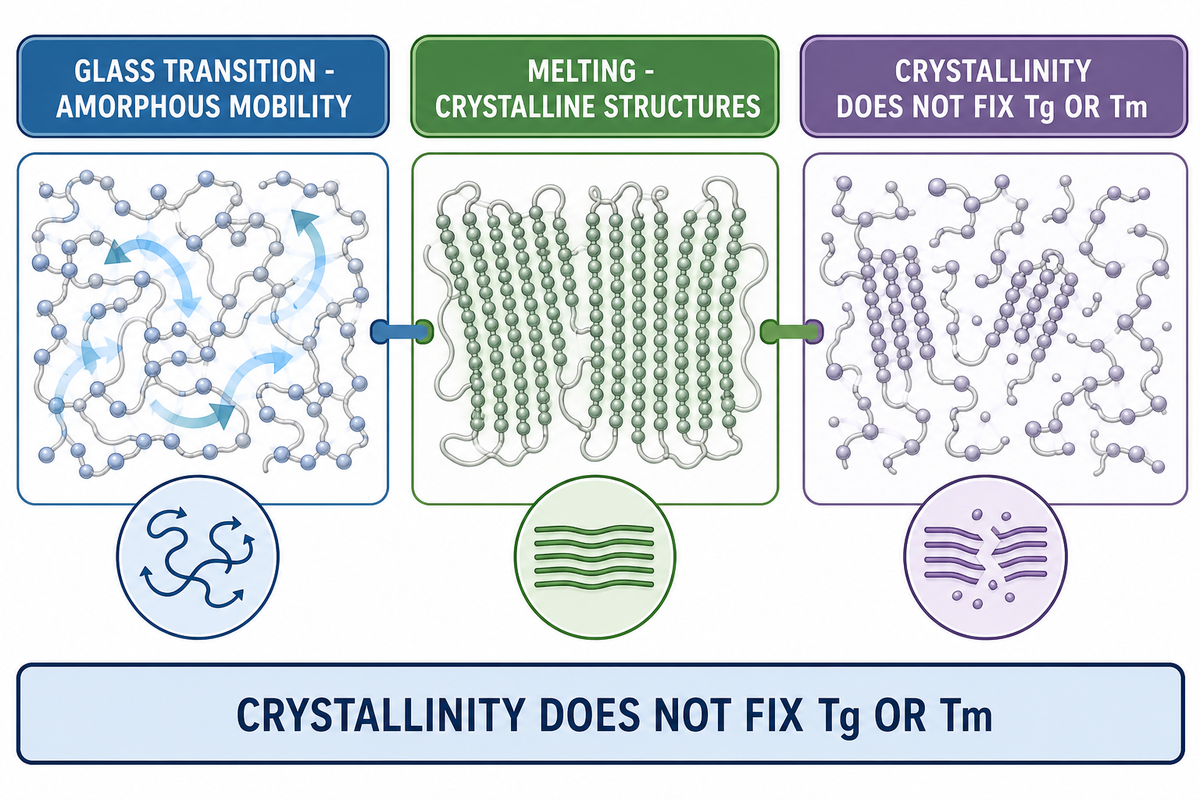
Glass transition primarily reflects cooperative mobility in amorphous material. Melting concerns crystalline structures. A semicrystalline material can therefore show both a glass transition and a melting event, sometimes with cold crystallization between them. Learn more about glass transition in polymers and why its test conditions matter.
A crystallinity percentage alone can’t fix the glass transition temperature and the melting point. However, there are other aspects to be considered, for example chemistry, molecular weight, type and amount of additives, constraints, crystal morphology and history of thermal treatment.
From the point of view of an application engineer, it’s risky to consider a given transition as equivalent to the other, since they usually describe different kinds of molecular motion. Most of the time it’s necessary to report separately the crystallization, glass transition and melting.
What Crystallinity Can, and Cannot, Predict About Performance
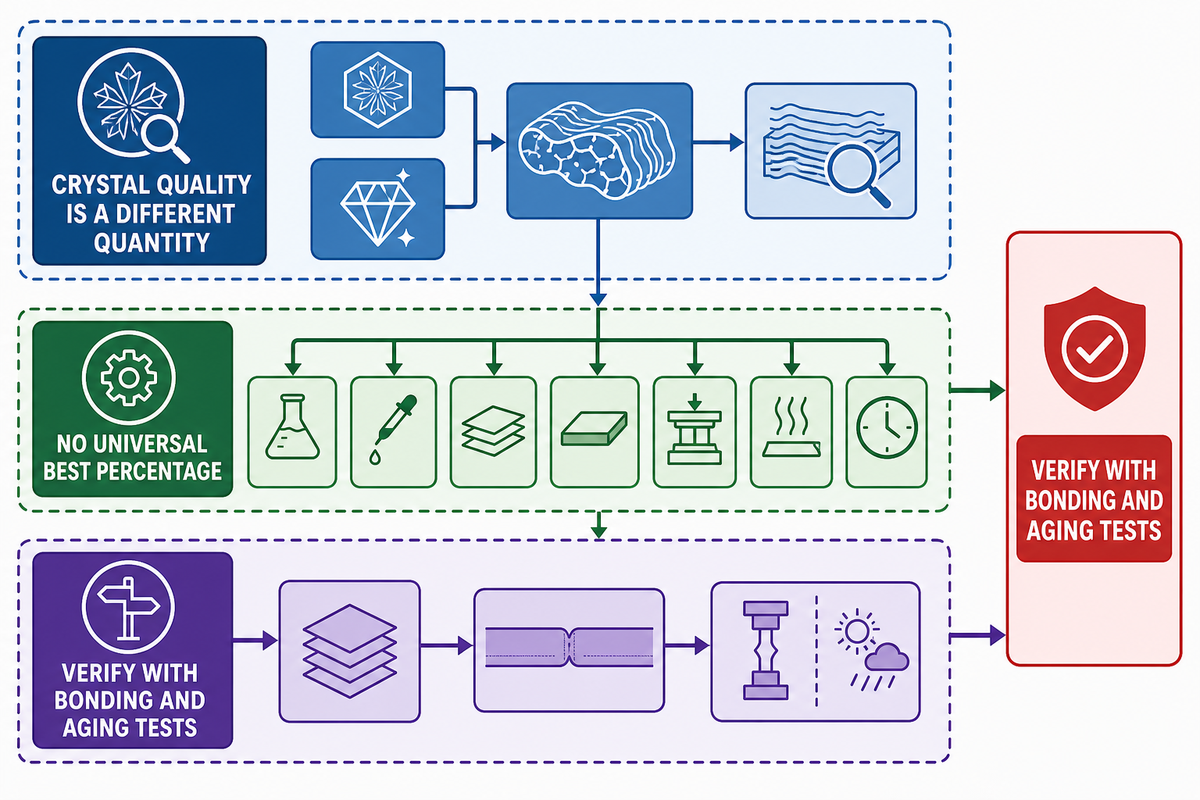
Within the framework of a given polymer chemistry, an increase in the crystalline fraction may lead to improvement of some mechanical and/or barrier properties and a change of the optical behavior of the polymer. The effects described above are limited to a given polymer. Crystalline quality is not the same quantity as degree of crystallinity.
For hot melt adhesives, variables like formulation morphology and crystallization can affect the thermal profile, the stiffness and the time required for the adhesive to set. Other variables that can influence the bond formation process include the type and composition of the resins and additives in the adhesive, the thickness of the adhesive layer, the substrate, and the conditions (pressure, time and temperature) under which the adhesive is held in contact with the substrate. TPU, EVA, PA, PES, and PO, and other families, can contain a large number of grades of adhesives. There are no generalities or universal guidelines to determine the optimal grade of an adhesive family.
The conservative approach is to use a documented morphology measurement to explain adhesive behavior, then verify it with bonding and aging tests.
In production applications, claims regarding the use of adhesives carry an overclaiming risk when they rest on crystallinity alone, because the performance of an adhesive in a particular bond is best assessed through an inspection plan with bonding and time-temperature aging tests.
A Reporting Framework for Trustworthy Comparisons
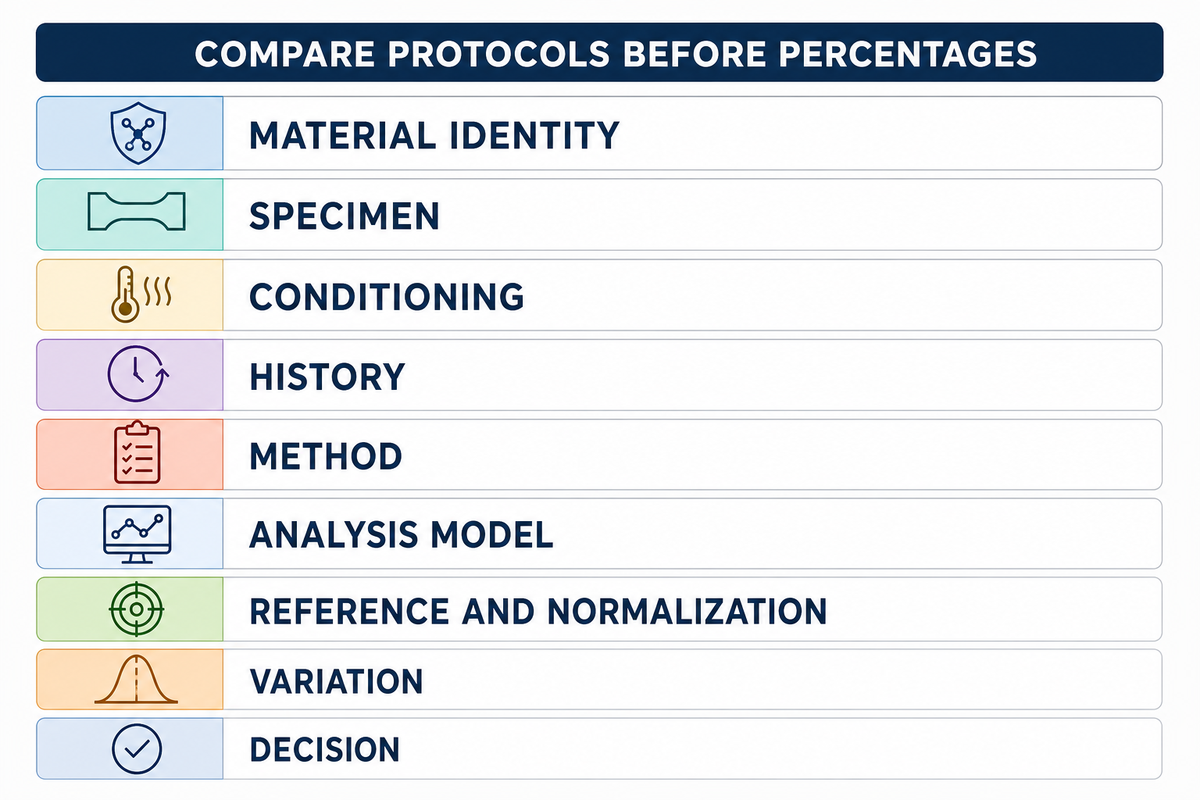
Compare protocols before percentages. The risk of a false comparison persists because a percentage is decision-ready only when the report carries the protocol, reference and specimen history. A decision-ready report should include:
| Reporting category | What to record |
|---|---|
| Material identity | Polymer family, grade, formulation and lot. |
| Specimen | Film, web, powder, pellet or part; sampling location, thickness and orientation. |
| Conditioning | Temperature, humidity, drying and storage time. |
| History | Prior thermal cycle, cooling rate, annealing, drawing and mechanical treatment. |
| Method | Instrument, standard, geometry and temperature program. |
| Analysis model | Phase model, baseline, peak fit or integration limits. |
| Reference and normalization | Enthalpy or density source, crystal form, filler or blend correction and polymer-mass basis. |
| Variation | Replicate count, dispersion and any location-to-location range. |
| Decision | The manufacturing or performance question the result is intended to support. |
Need help selecting a suitable hot-melt adhesive material for your process? Shanghai Tengyang can assist with preliminary process evaluation for hot-melt adhesive films, webs, powders and granules; final suitability should be confirmed in your process.
Frequently Asked Questions
What does crystallinity mean in polymers?
Crystallinity refers to the fraction of a polymer specimen belonging to ordered regions under specific conditions. The large majority of crystallizable polymers is semi-crystalline. Most crystallizable polymers are semicrystalline: crystalline lamellae coexist with amorphous regions and, in some models, an interphase. In crystallinity studies, the interpretation of DSC, XRD and density data is usually contextual and dependent on the assumptions made. The condition of the specimen, the reference states and the limits of the analysis should therefore be stated.
How is polymer crystallinity measured?
DSC allows the determination of the melting and crystallization temperatures and the associated enthalpies. XRD and WAXD determine ordered and diffuse scattering. Density techniques measure the specimen’s specific volume and compare it with crystalline and amorphous reference states. In general, data obtained by different techniques, especially when different physical quantities are measured, should be considered in conjunction to narrow the limits of the results.
Why do DSC and XRD give different crystallinity values?
DSC can assign polymer crystallinity from heat-flow-derived enthalpy, while XRD assigns ordered and diffuse scattering under its measurement geometry. Because they observe different physical signals and use different assumptions, the two methods can return different fractions for the same specimen; their results can be complementary rather than contradictory.
Does higher crystallinity always make a polymer stronger?
No. An increase in order that occurs as a result of crystallizing may correlate with strength and stiffness in a controlled material system, but it isn’t generally accepted as proof of universal performance. However, the nature of the relationships depends strongly on the system and on the processing conditions. Therefore, these properties and relationships, by themselves, can’t be used to define the performance of the system, and percentages can’t be regarded as strength and performance limits.
Can a polymer be 100% crystalline?
A fully crystalline reference state is an idealized basis for comparative calculations, not proof that a real specimen is perfectly ordered. A reported 100% can also reflect how a selected model and reference were applied, not proof that every chain segment occupies a perfect lattice. A reported 100% may indicate that a state of perfect order was assumed, and it should prompt review of the reference state, normalization, phase model and instrument limits.
References & Sources
- ISO 11357-3:2025 public scope for conventional DSC melting and crystallization temperatures and enthalpies.
- University of Utah Materials Characterization Lab density and enthalpy routes and their reference-data requirements.
- TA Instruments DSC training: initial crystallinity calculation melting-minus-cold-crystallization calculation and fully crystalline reference basis.
- NETZSCH thermoplastic-composite application note polymer-mass correction for a fiber-filled specimen.
- Polymer International: degree of crystallinity versus crystalline quality method and length-scale distinctions.
- TA Instruments crystallinity application brief bounded polyethylene thermal-history example.
- Crystallinity determination by First-Law DSC temperature-matched comparison with density and WAXD.
- Copolyester hot-melt adhesive thermal, rheological and tack study bounded relationships among composition, crystallinity, thermal response and mechanical behavior.
- Hot-melt adhesive wax morphology study crystallization profiles and their relationship to adhesive set time.
- Engineering LibreTexts: amorphous and semicrystalline polymers polymer-physics background.
Technical note: This article is educational. It doesn’t warrant the suitability of the material for a specific application or end use. In addition, no statement made herein is to be taken as a representation that any product or method is either viable or properly designed for the purposes for which it’s intended.
ABOUT TENGYANG
Industrial hot melt adhesive materials for bonding routes
Shanghai Tengyang New Materials Technology Co., Ltd. supports material discussions for production teams working with bonded products.
Available forms: hot melt adhesive film, web, powder and granules. Material families: TPU, EVA, PA, PES and PO.
CONTACT PROFILE
Betty Fang
Contact for material inquiries.